Fig. 6.
Download original image
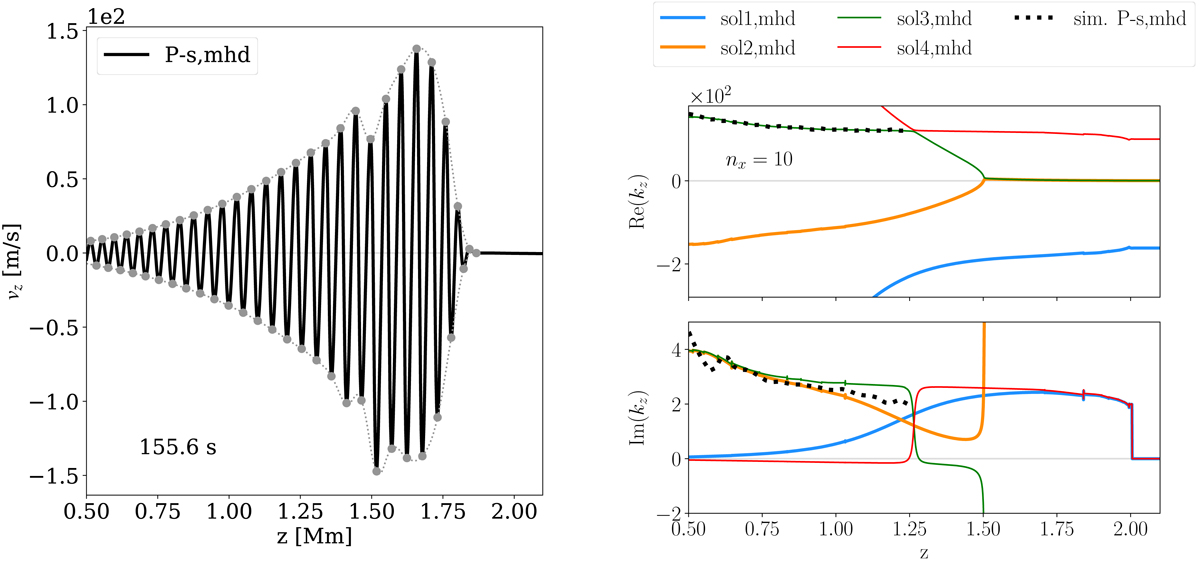
Comparison between the numerical and analytical results for the simulations shown in Fig. 4. Left: profile of vertical velocity along x = 0 for P-s. Right: local dispersion relation corresponding to the simulations shown in Fig. 4. The complex vertical wavenumber kz(z) values calculated from the P-s simulation are overplotted on the dispersion diagram with the black dotted lines, up to the equipartition height, and they are clearly in perfect agreement with the upward fast wave (in green).
Current usage metrics show cumulative count of Article Views (full-text article views including HTML views, PDF and ePub downloads, according to the available data) and Abstracts Views on Vision4Press platform.
Data correspond to usage on the plateform after 2015. The current usage metrics is available 48-96 hours after online publication and is updated daily on week days.
Initial download of the metrics may take a while.