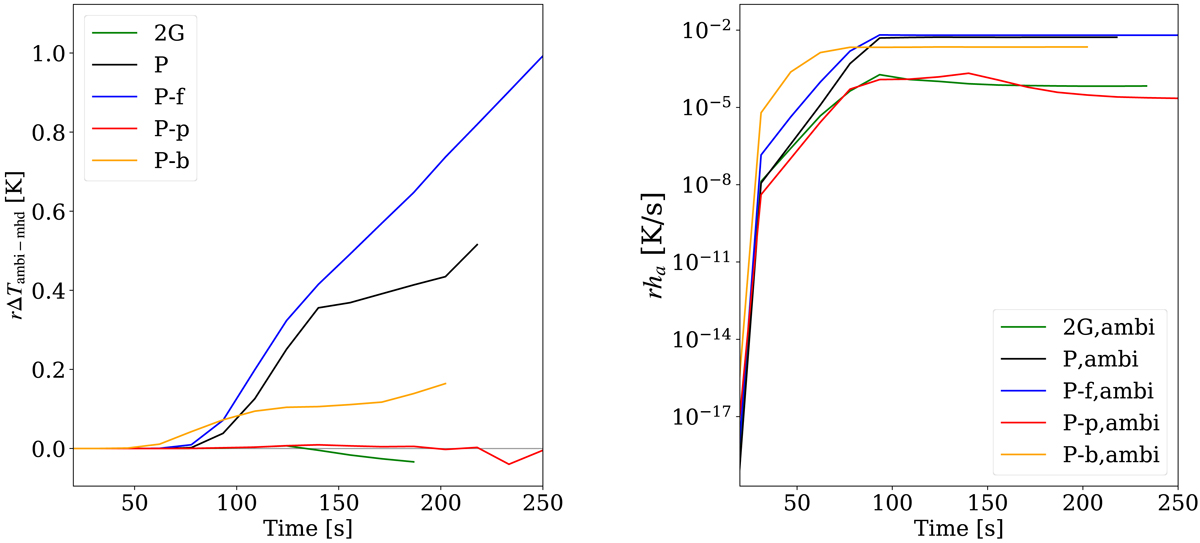
Fig. 18.
Download original image
Time evolution of the average of the difference in the mean temperature between the ambipolar and MHD simulations (left panel) and the increase in temperature in a unit of time corresponding to the ambipolar heating ha (right panel). The averages are done in the z-direction between the heights 0.8 and 1.7 Mm, and in the x-direction. To ease the comparison, the quantities have been normalized using the value r, defined in Eq. (19).
Current usage metrics show cumulative count of Article Views (full-text article views including HTML views, PDF and ePub downloads, according to the available data) and Abstracts Views on Vision4Press platform.
Data correspond to usage on the plateform after 2015. The current usage metrics is available 48-96 hours after online publication and is updated daily on week days.
Initial download of the metrics may take a while.