Fig. 14.
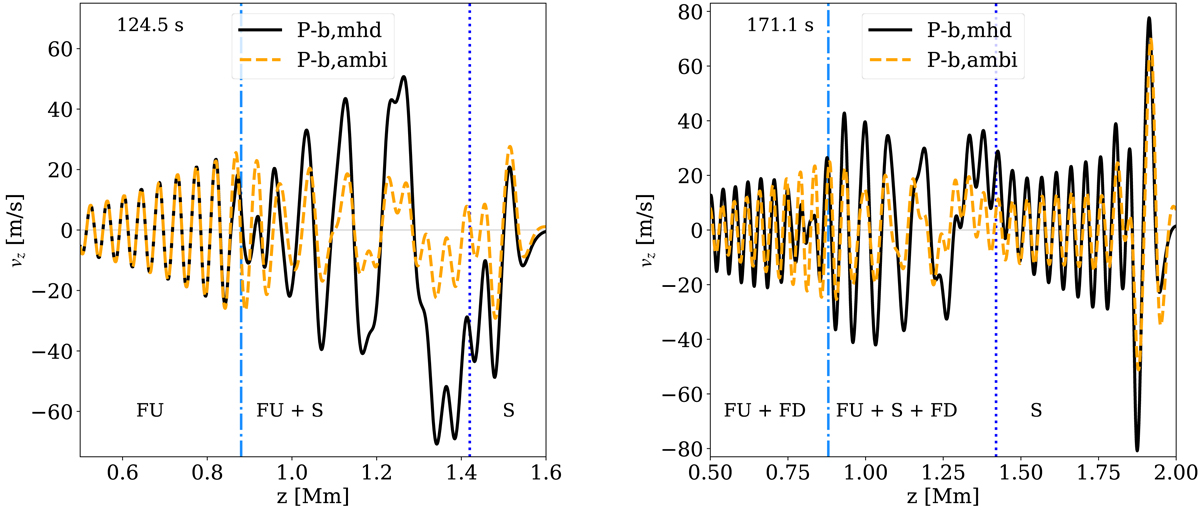
Download original image
Vertical cuts at x = 0 for the vertical velocity for the simulation P-b at two different times (note the changing axis scales). This can be compared with the weaker field strength case from Fig. 10, left panel. The equipartition height is shown by a vertical light blue dotted line located at z = 0.85 Mm in both panels. Right panel: the vertical dotted dark blue line located at z = 1.42 Mm indicates the reflection height of the fast component. The wave modes: upward fast (FU), slow (S), and downward fast (FD) present in each of the regions are indicated in the panels.
Current usage metrics show cumulative count of Article Views (full-text article views including HTML views, PDF and ePub downloads, according to the available data) and Abstracts Views on Vision4Press platform.
Data correspond to usage on the plateform after 2015. The current usage metrics is available 48-96 hours after online publication and is updated daily on week days.
Initial download of the metrics may take a while.