Fig. 7.
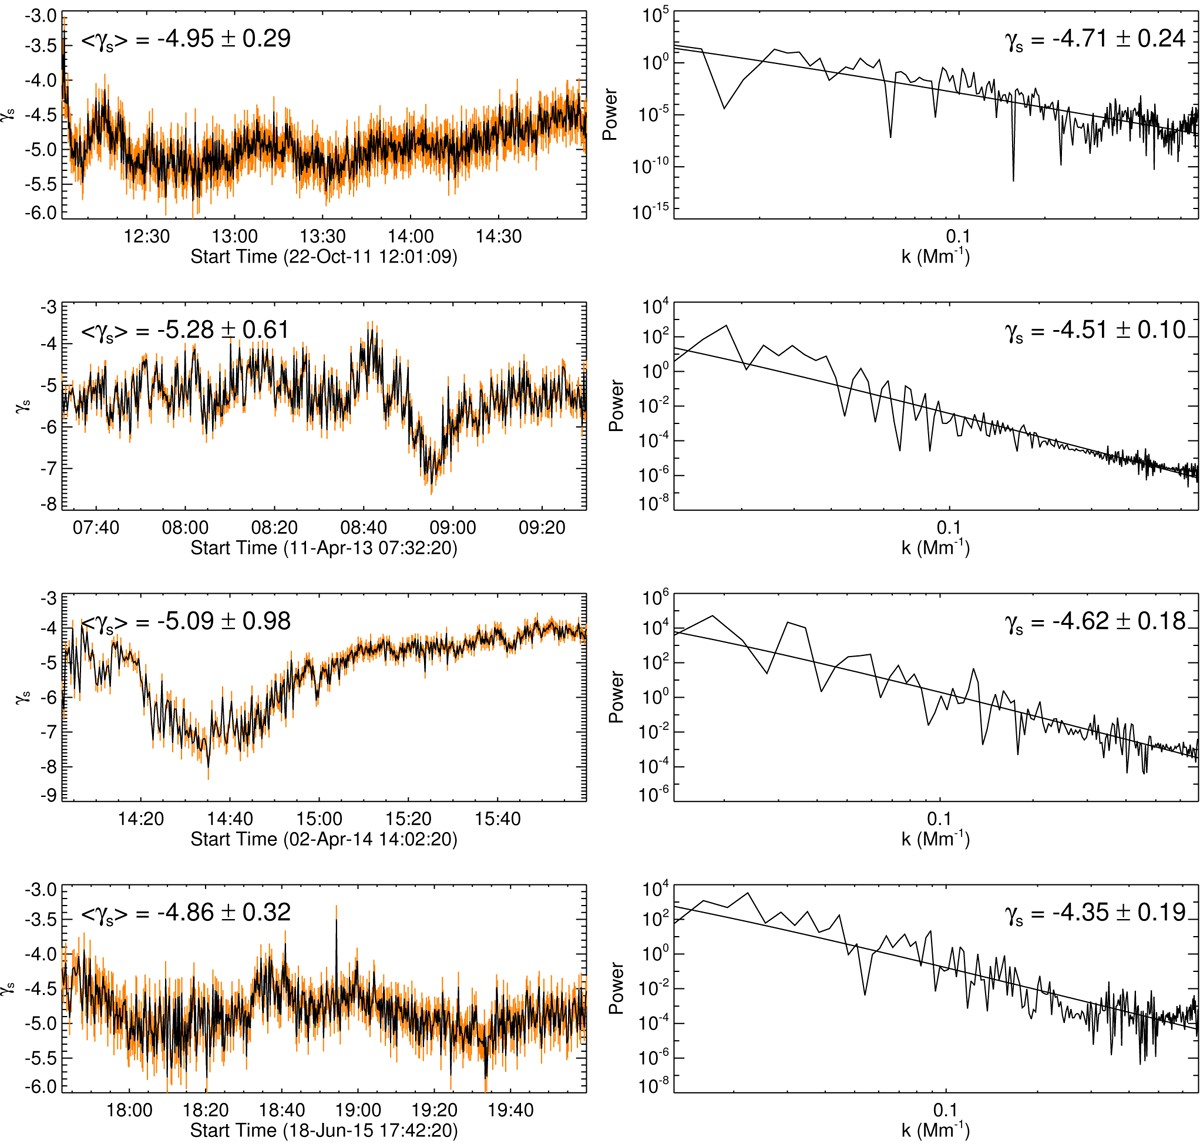
Download original image
Structure of supra-arcade EUV emission in terms of spatial frequency. The power spectrum of any vertical slice in the time-distance diagram (panel c of Figs. 2–5) is fitted with a power-law function. The temporal variation of the power-law index γs is shown in the left panels. The orange bars indicate the 1σ uncertainty estimates in the fittings. The power spectrum of the time-distance diagram collapsed along the time axis is shown in the right panels.
Current usage metrics show cumulative count of Article Views (full-text article views including HTML views, PDF and ePub downloads, according to the available data) and Abstracts Views on Vision4Press platform.
Data correspond to usage on the plateform after 2015. The current usage metrics is available 48-96 hours after online publication and is updated daily on week days.
Initial download of the metrics may take a while.