Free Access
Fig. 4.
Download original image
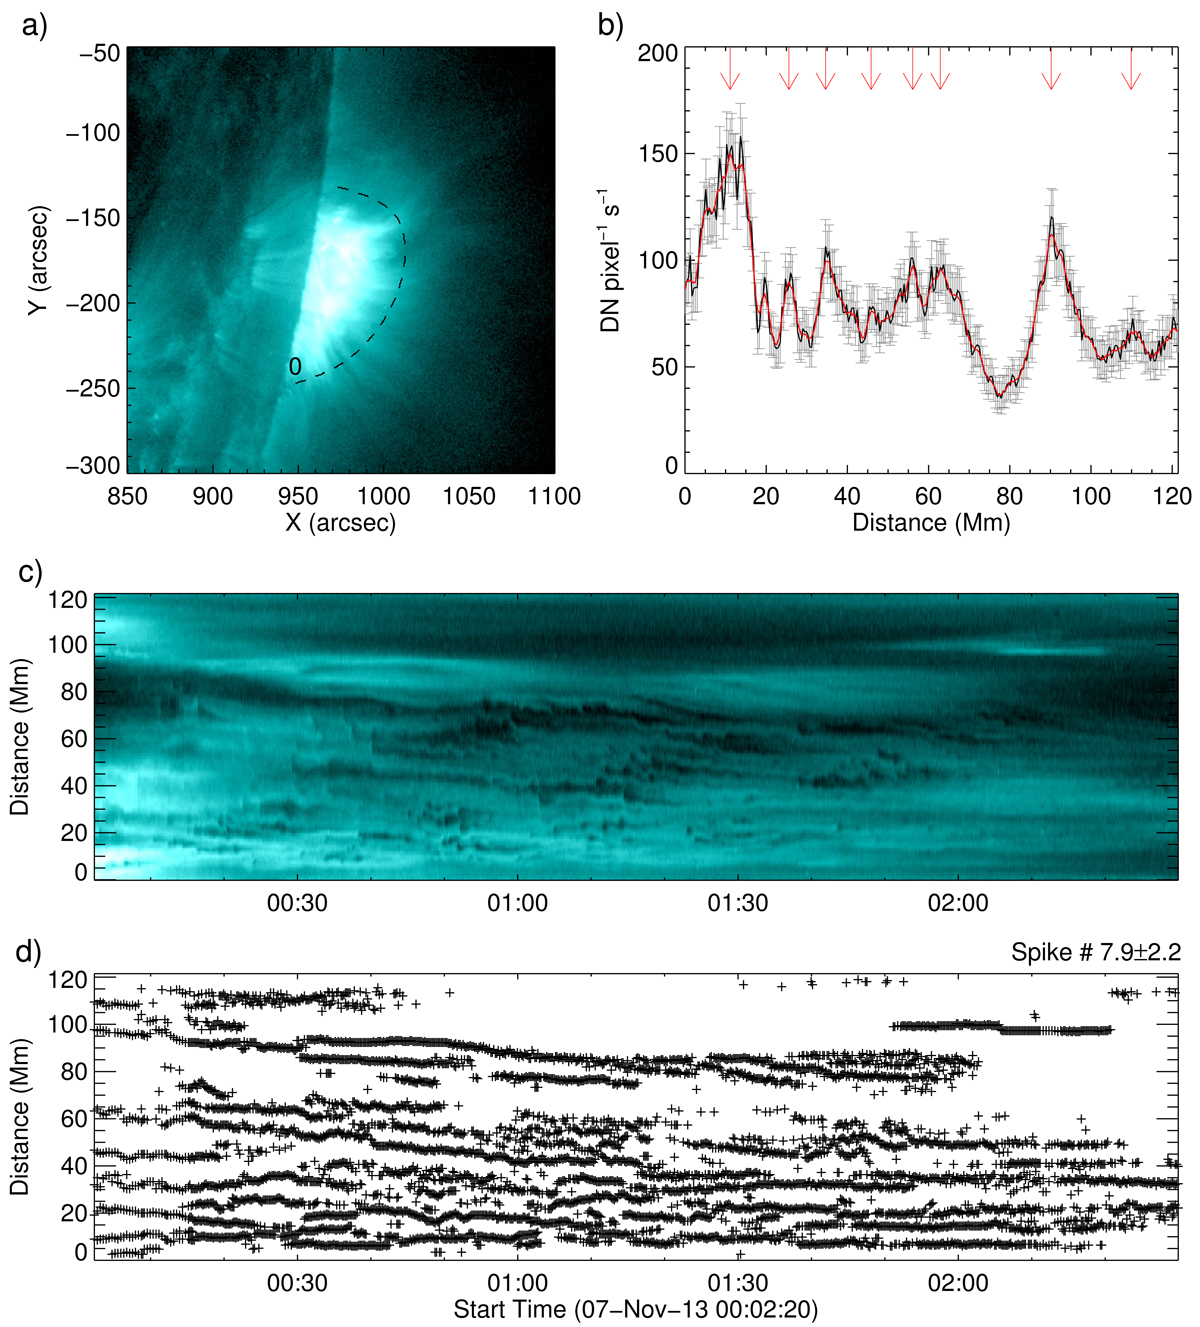
Supra-arcade spikes observed in the 2013 November 7 event. The panels are shown in the same format as in Fig. 2. (a) AIA 131 Å 7-Nov-2013 00:25:44.620, (b) Slit, (c) Time-Distance Diagram, (d) Identification of Spikes.
Current usage metrics show cumulative count of Article Views (full-text article views including HTML views, PDF and ePub downloads, according to the available data) and Abstracts Views on Vision4Press platform.
Data correspond to usage on the plateform after 2015. The current usage metrics is available 48-96 hours after online publication and is updated daily on week days.
Initial download of the metrics may take a while.