Fig. 2.
Download original image
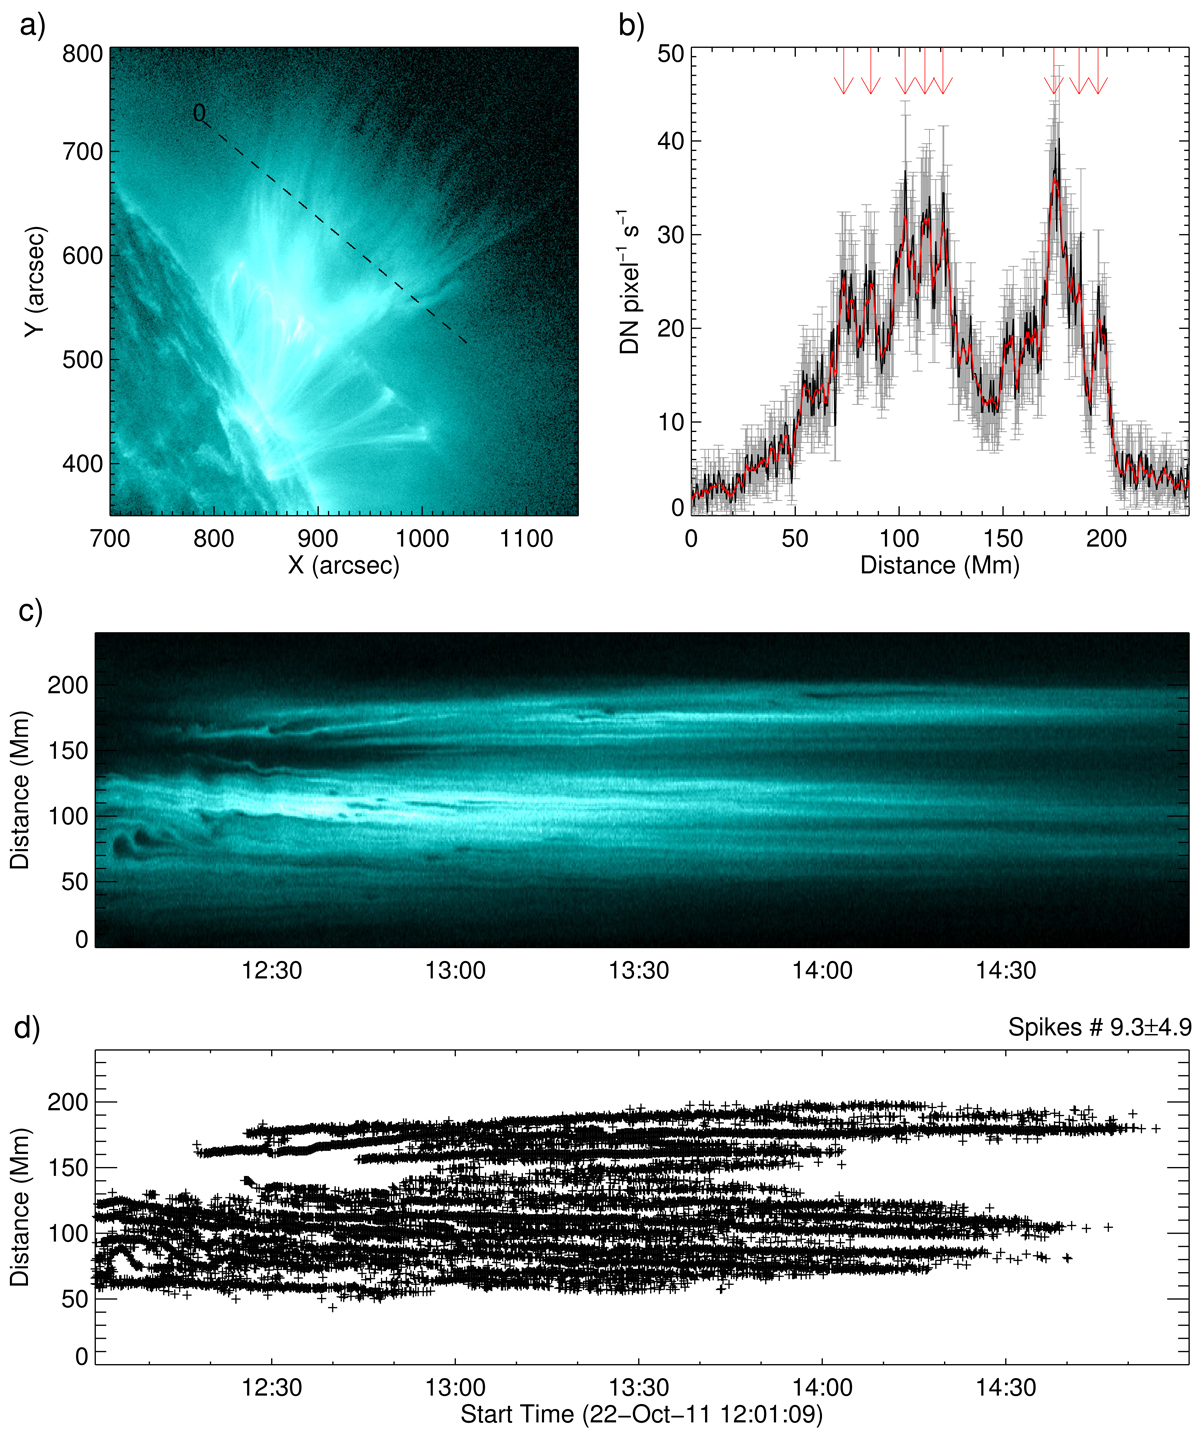
Supra-arcade spikes observed in the 2011 October 22 event. Panel a: snapshot of the flare in the SDO/AIA 131 Å passband. The brightness in units of DN pixel−1 s−1 along a virtual slit (dashed line) is plotted in (b). The starting end of the slit is labeled “0”. In (b) the red curve shows a five-point running average, the error bars indicate the measurement errors given by AIA_BP_ESTIMATE_ERROR, and the red arrows on the top denote the local maximums identified as the spikes. Panel c: evolution of the supra-arcade emission seen through the slit in (a). The identified spikes along the slit are indicated as crosses in (d), which has the same time and distance axes as in (c). (a) AIA 131 Å 22-Oct-2011 13:59:57.620, (b) Slit, (c) Time-Distance Diagram, (d) Identification of Spikes.
Current usage metrics show cumulative count of Article Views (full-text article views including HTML views, PDF and ePub downloads, according to the available data) and Abstracts Views on Vision4Press platform.
Data correspond to usage on the plateform after 2015. The current usage metrics is available 48-96 hours after online publication and is updated daily on week days.
Initial download of the metrics may take a while.