Fig. 10.
Download original image
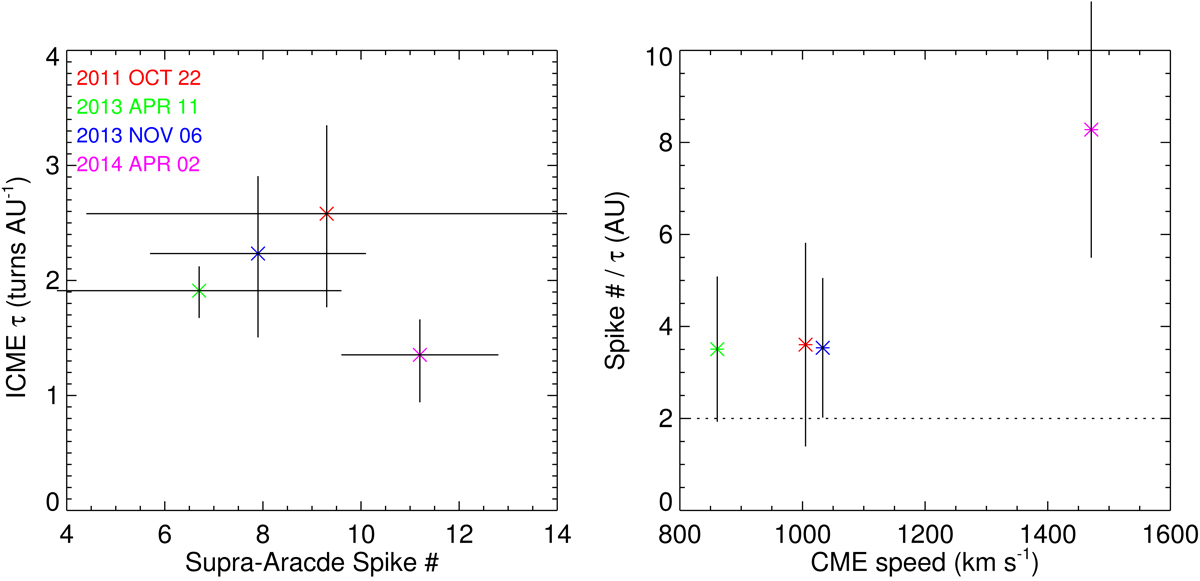
Implication of the number of SASes for ICMEs. Left panel: twist density τ of ICMEs vs. the number of spikes. The error bars for the former are given by the fitting of ICMEs with a uniformly twisted flux-rope model (see the text for details), and those for the latter are the standard deviations of the average number of spikes detected during the selected time intervals during the flare decay phase of each event. Right panel: ratio of the number of spikes over τ in relation to the CME speed estimated in the inner heliosphere. The error bars are given by the propagation of uncertainties.
Current usage metrics show cumulative count of Article Views (full-text article views including HTML views, PDF and ePub downloads, according to the available data) and Abstracts Views on Vision4Press platform.
Data correspond to usage on the plateform after 2015. The current usage metrics is available 48-96 hours after online publication and is updated daily on week days.
Initial download of the metrics may take a while.