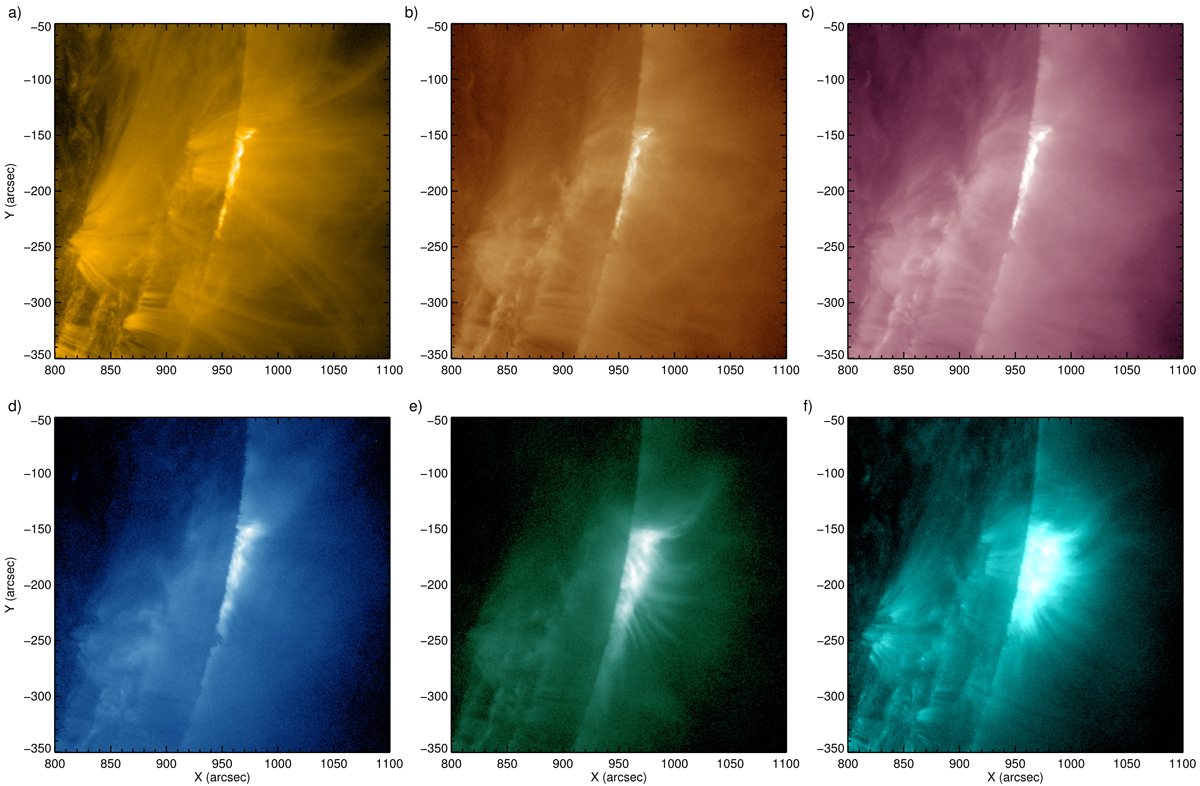
Fig. 1.
Download original image
Post-flare arcade observed by different SDO/AIA passbands on 2013 November 7 (Event #3 in Table 1). The panels are arranged in an order of increasing characteristic temperatures of the AIA passbands (O’Dwyer et al. 2010). The SASs are only visible in 94 and 131 Å. An animation of AIA 131 Å images is available online. (a) SDO/AIA 171 Å 2013-11-07T00:25:48.918, (b) SDO/AIA 193 Å 2013-11-07T00:25:45.317, (c) SDO/AIA 211 Å 2013-11-07T00:25:35.624, (d) SDO/AIA 335 Å 2013-11-07T00:25:38.627, (e) SDO/AIA 94 Å 2013-11-07T00:25:37.124, (f) SDO/AIA 94 Å 2013-11-07T00:25:37.124.
Current usage metrics show cumulative count of Article Views (full-text article views including HTML views, PDF and ePub downloads, according to the available data) and Abstracts Views on Vision4Press platform.
Data correspond to usage on the plateform after 2015. The current usage metrics is available 48-96 hours after online publication and is updated daily on week days.
Initial download of the metrics may take a while.