Fig. 9
Download original image
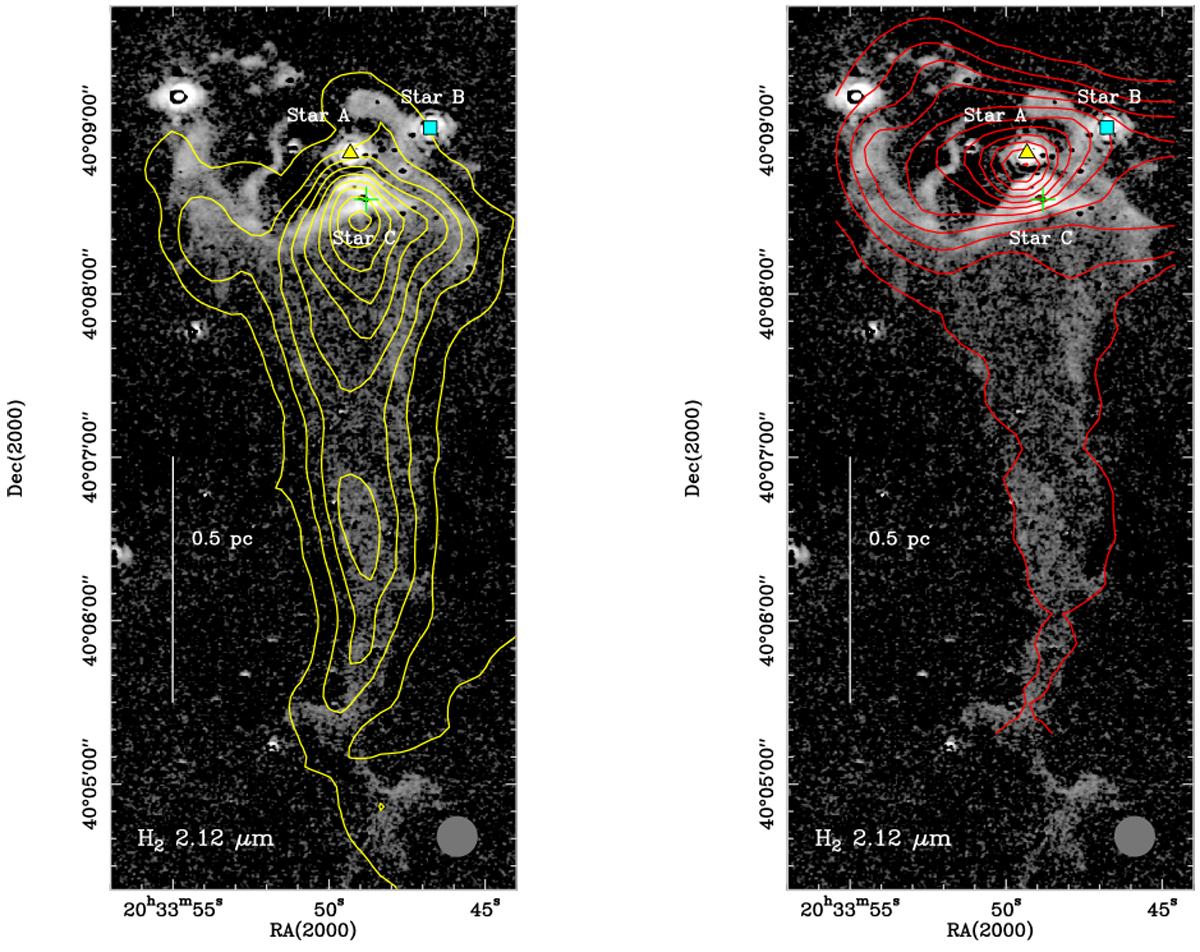
Continuum subtracted narrow-band image that contains the H2 1–0 S(1) ro-vibrational line at 2.122 μm (Djupvik et al. 2017) at ~2″ resolution with contours of velocity-integrated 12CO 3→2 emission (yellow, left panel) and velocity-integrated [C II] emission (red, right panel), both at 15″ resolution, overlaid. The CO contours go from 1 to 13 by 1.5 K km s−1 and the [C II] contours go from 5 to 155 by 15 K km s−1. The embedded stars A, B, and C are indicated.
Current usage metrics show cumulative count of Article Views (full-text article views including HTML views, PDF and ePub downloads, according to the available data) and Abstracts Views on Vision4Press platform.
Data correspond to usage on the plateform after 2015. The current usage metrics is available 48-96 hours after online publication and is updated daily on week days.
Initial download of the metrics may take a while.