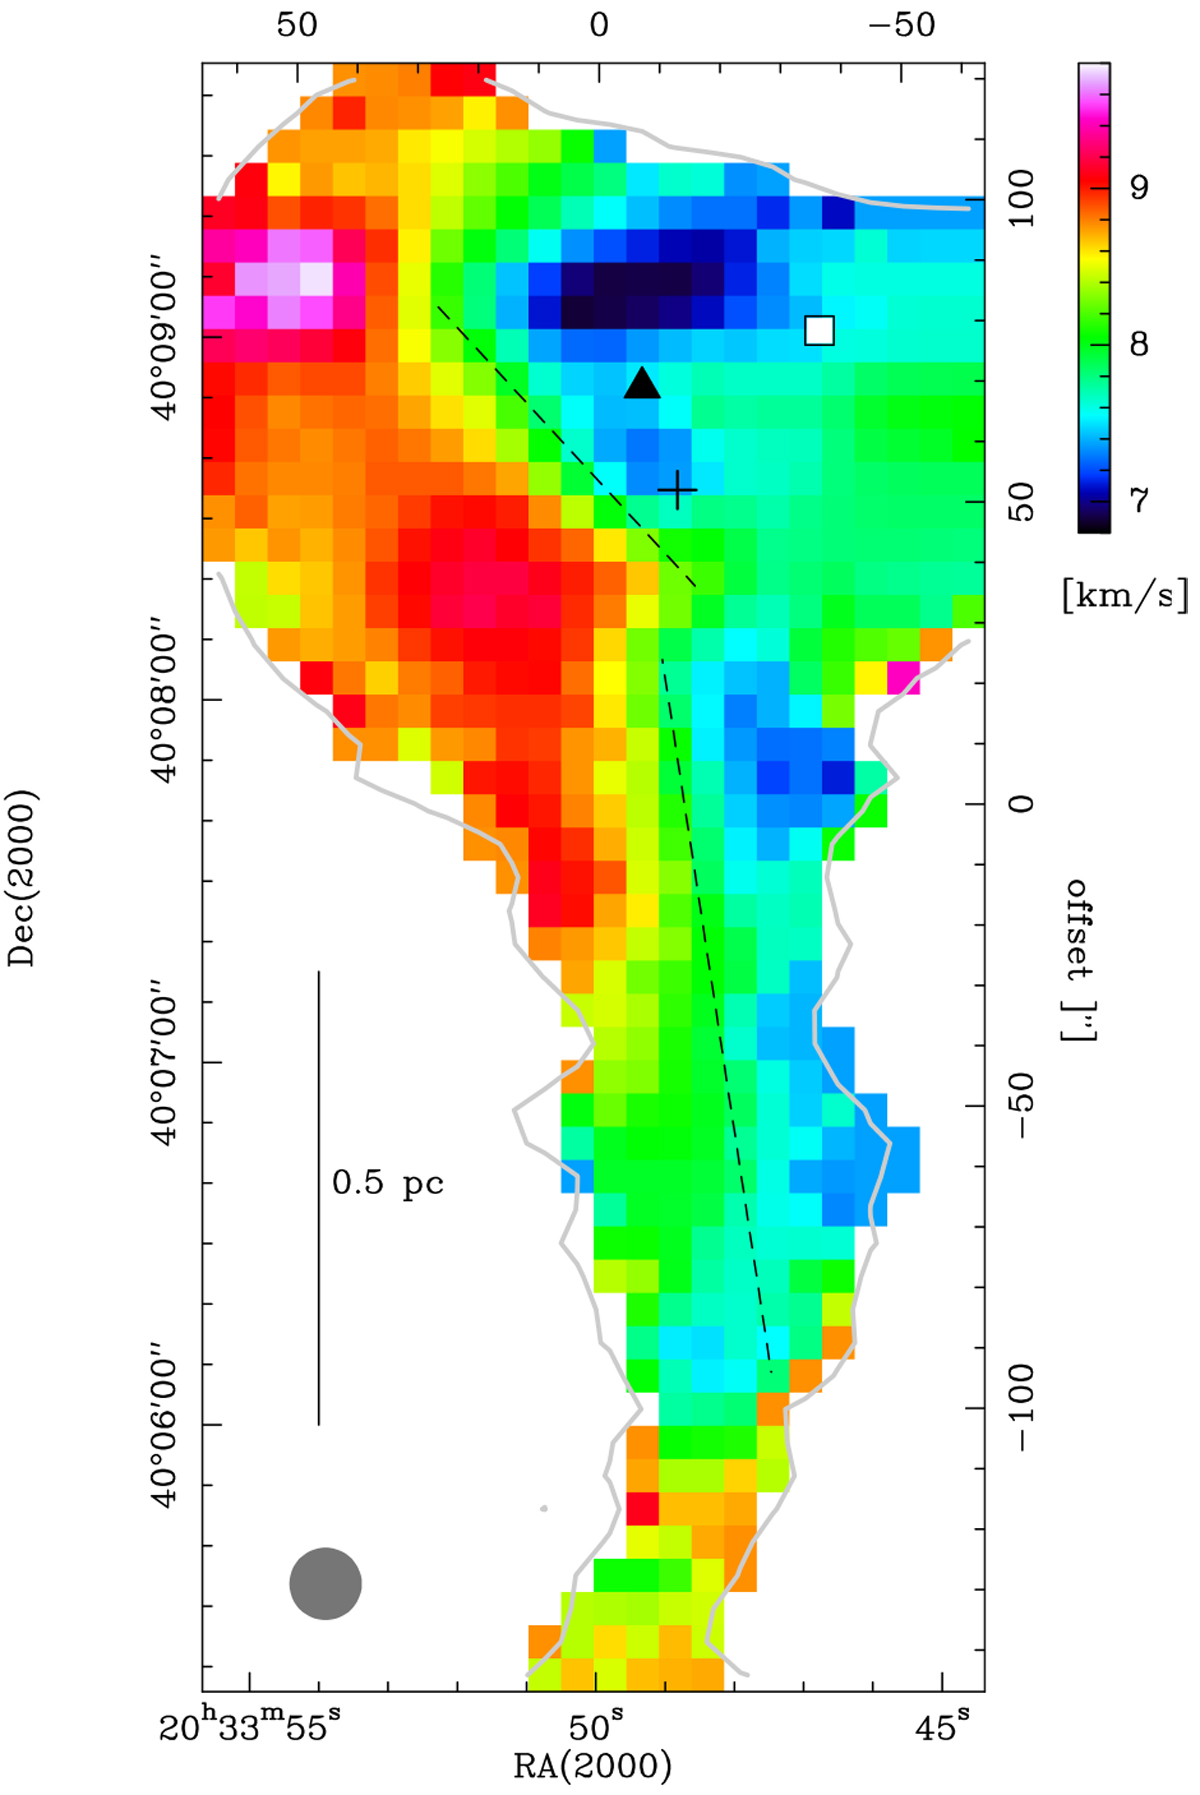
Fig. 8
Download original image
Velocity map (first moment) of the [C II] emission, showing possible patterns of counter-clockwise rotation with the approximate axes indicated with dashed lines. The centre position (0,0) is at RA(2000) = 20h33m49.95, Dec(2000) = 40°07′42.75″. The [C II] beam is indicated in the lower left corner. We note that the axes for the globule head, where most of the mass resides, and the tail have not the same inclinations, and the velocity difference is larger for the head (~9.5 to ~6.9 km s−1) than for the tail (~8.3 to ~7.4 km s−1). The grey contour outlines the 2 K km s−1 contour level of [C II] emission, the symbols are the same as in Fig. 4.
Current usage metrics show cumulative count of Article Views (full-text article views including HTML views, PDF and ePub downloads, according to the available data) and Abstracts Views on Vision4Press platform.
Data correspond to usage on the plateform after 2015. The current usage metrics is available 48-96 hours after online publication and is updated daily on week days.
Initial download of the metrics may take a while.