Fig. 3
Download original image
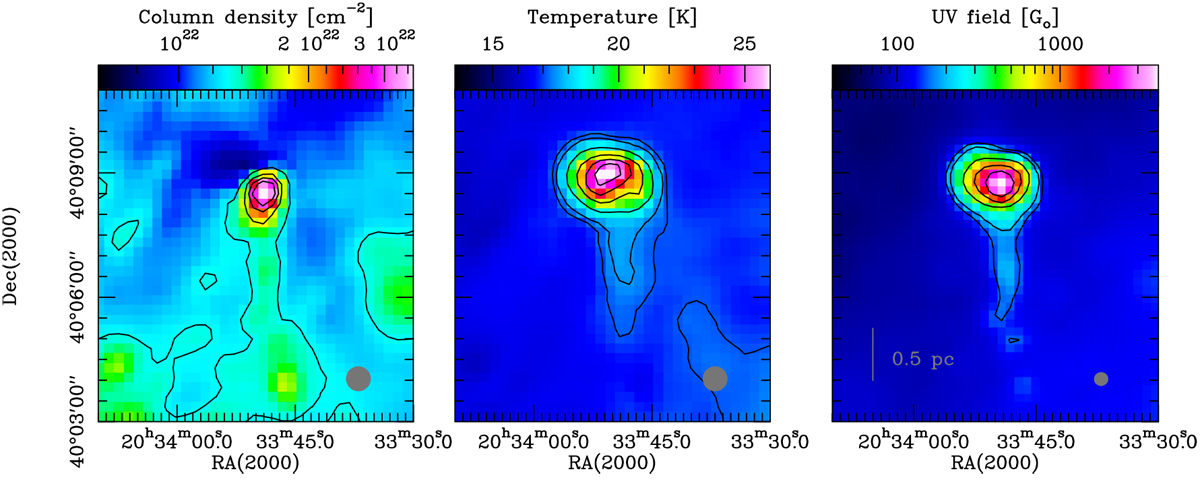
Herschel view of the globule. From left to right: column density (contours 1.3, 1.8, 2.3, 2.8 1022 cm−2), temperature (contours 17.1, 17.5, 19, 21, 23, 25 K), and UV-flux map (contours 150, 200, 500, 1000, 2000 G°) of the globule obtained from Herschel. These images are cut-outs from figures shown in Schneider et al. (2016). The column density and temperature maps have an angular resolution of 36″ and the UV map of 20″. These resolutions are indicated in the lower right corner of each panel.
Current usage metrics show cumulative count of Article Views (full-text article views including HTML views, PDF and ePub downloads, according to the available data) and Abstracts Views on Vision4Press platform.
Data correspond to usage on the plateform after 2015. The current usage metrics is available 48-96 hours after online publication and is updated daily on week days.
Initial download of the metrics may take a while.