Fig. 2
Download original image
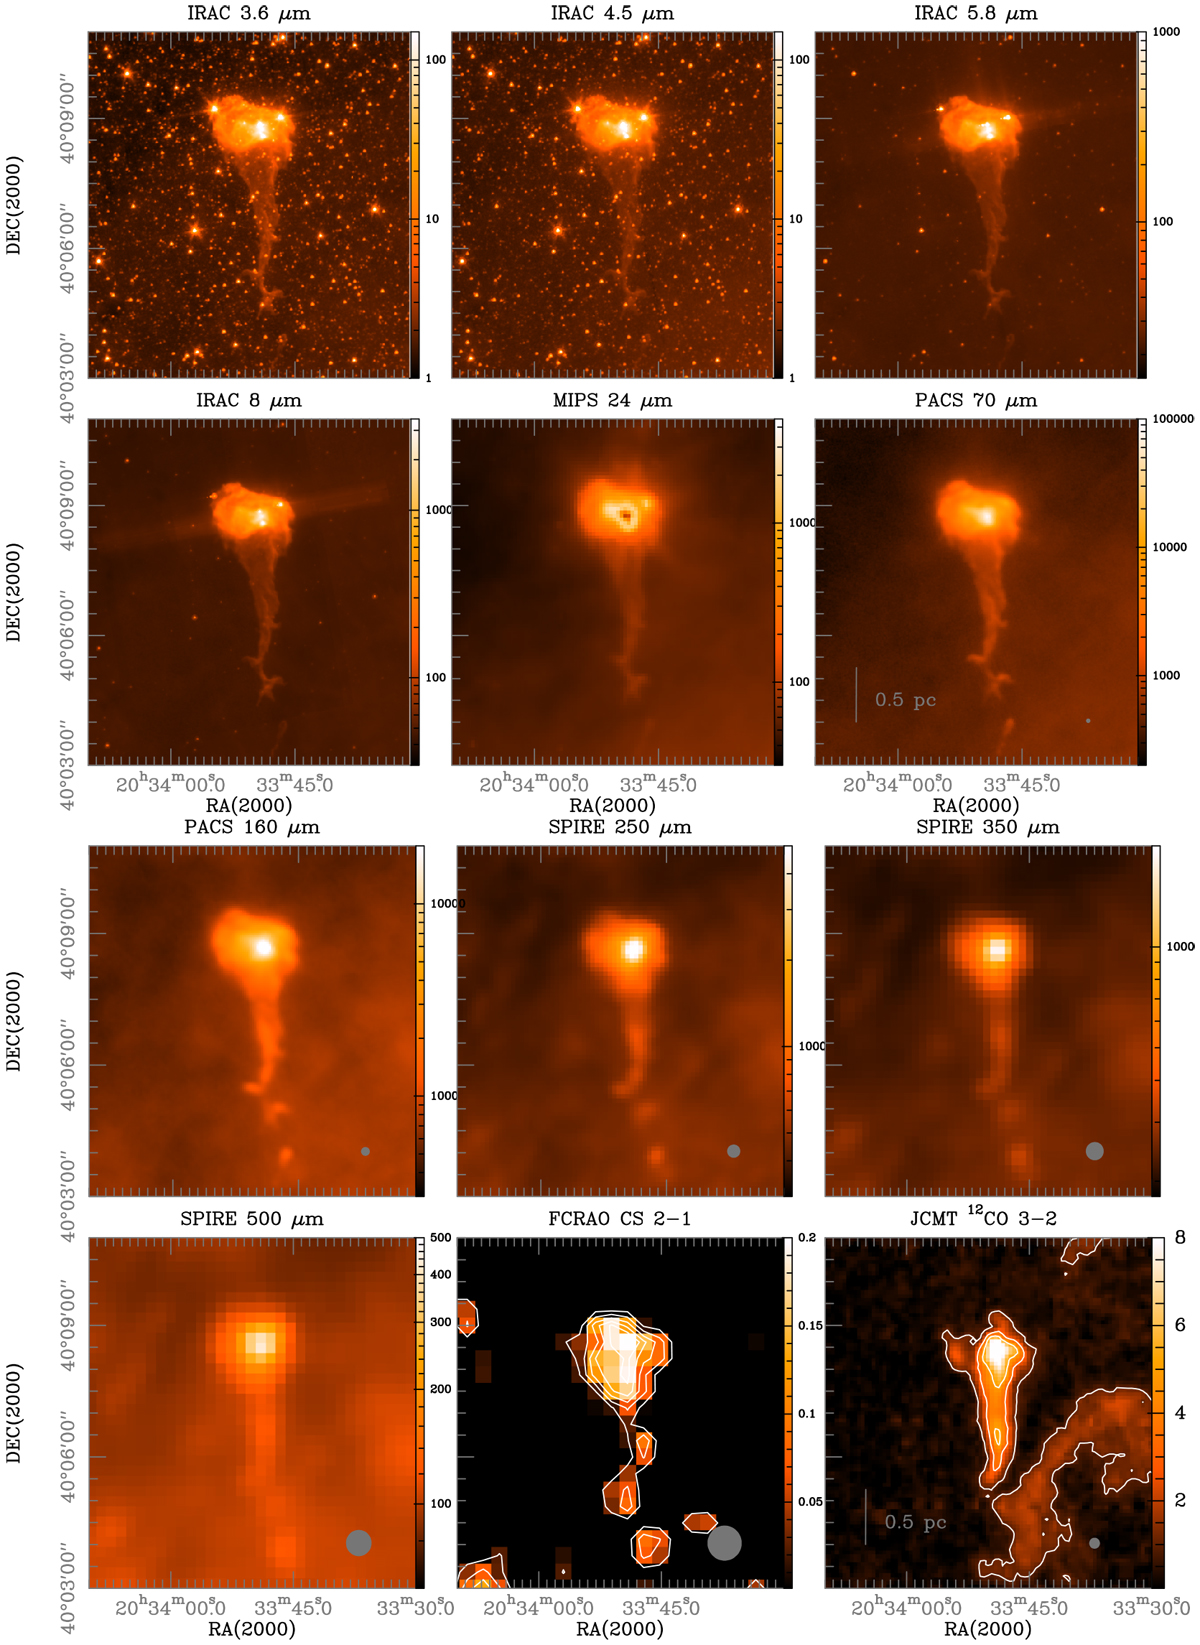
Globule at IR- and FIR-wavelengths: Spitzer/IRAC 3.6–8 μm, Spitzer/MIPS at 24 μm, Herschel/PACS 70, and 160 μm and SPIRE 250, 350, and 500 μm (all units areMJy sr−1). The two lower right panels show velocity integrated molecular line emission of CS 2→1 and 12CO 3→2 in [K km s−1]. The beam is indicated in all panels with longer wavelength observations (starting with PACS 160 μm) in the lowerright corner. The Spitzer data were already displayed in Djupvik et al. (2017) and the Herschel data in Schneider et al. (2016).
Current usage metrics show cumulative count of Article Views (full-text article views including HTML views, PDF and ePub downloads, according to the available data) and Abstracts Views on Vision4Press platform.
Data correspond to usage on the plateform after 2015. The current usage metrics is available 48-96 hours after online publication and is updated daily on week days.
Initial download of the metrics may take a while.