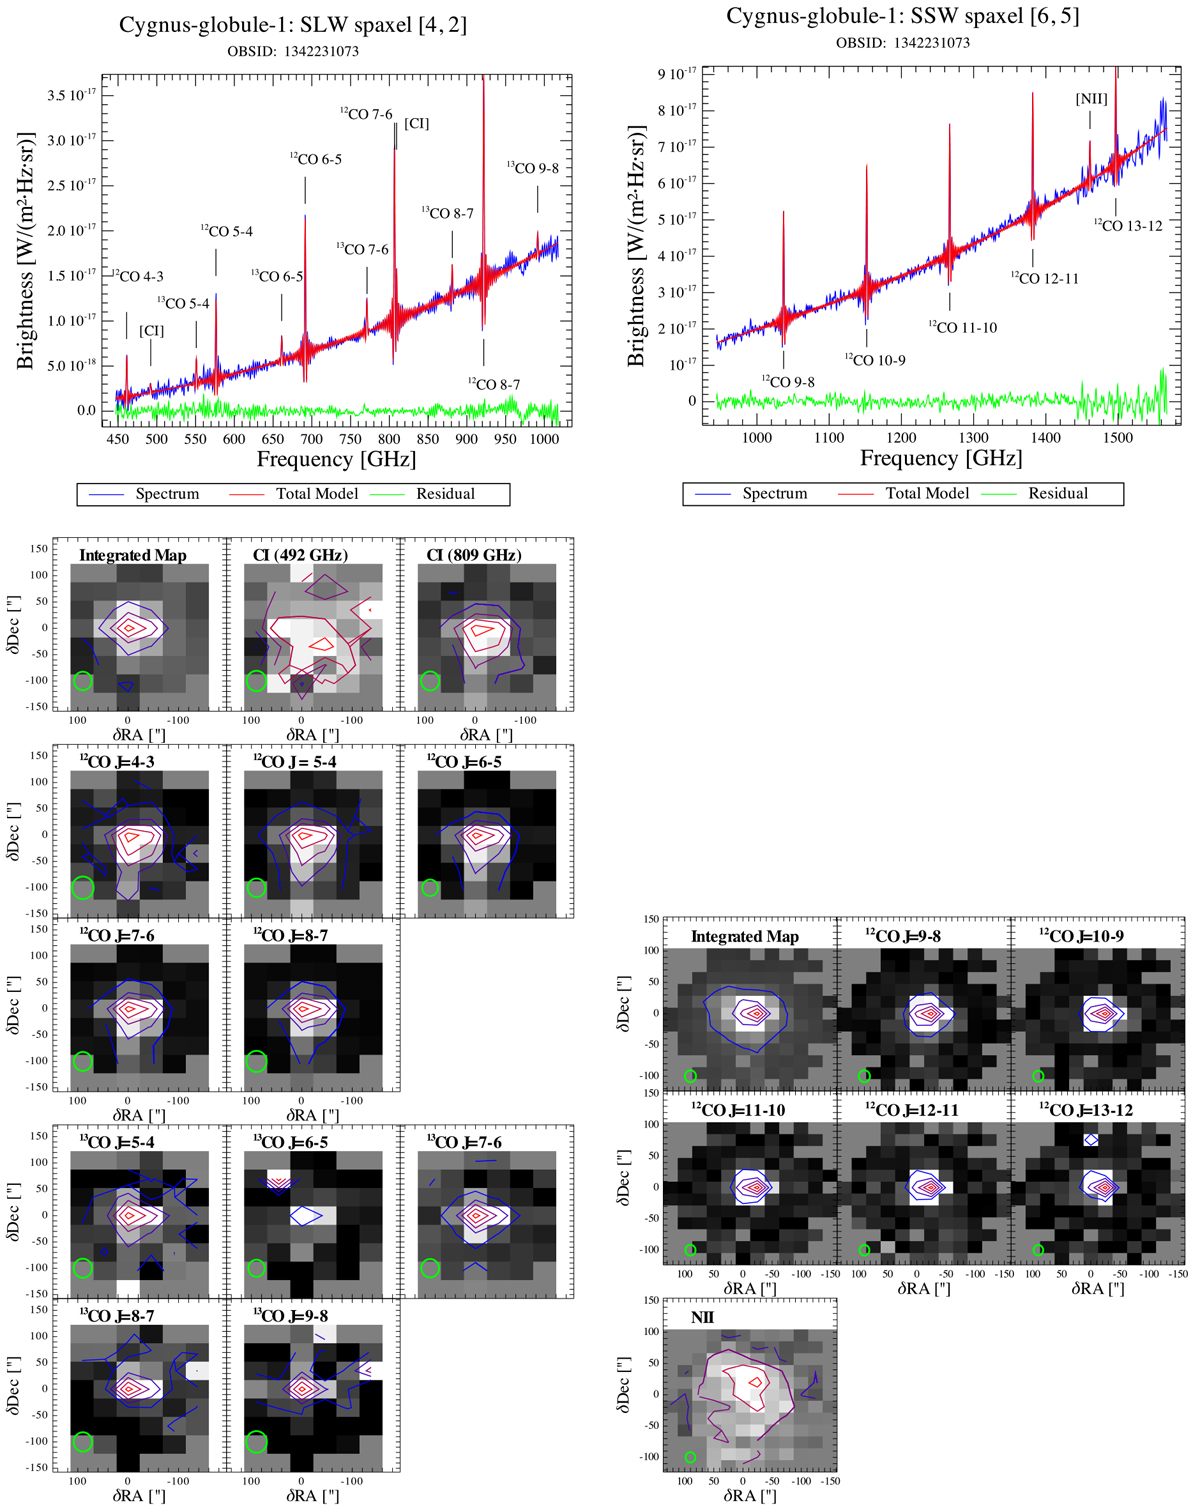
Fig. A.2
Download original image
SPIRE spectroscopy results for the globule head. Top: FTS spectrum (blue) and line fit (red) for one spaxelof the SPIRE spectrometer for SLW (left) and SSW (right). The positions of the spectral lines included inthe fit are indicated. Bottom: Full SPIRE spectral maps showing the CO-ladder and the [C I] and [N II] lines.The intensity scale has been set relative to the peak brightness in each map with contour levels at 0.1, 0.3, 0.5, 0.7 and 0.9 of the peak (from blue to red). The SPIRE beam size varies between 31-43″ for SLW and 16-20″ for SSW (Swinyard et al. 2014).
Current usage metrics show cumulative count of Article Views (full-text article views including HTML views, PDF and ePub downloads, according to the available data) and Abstracts Views on Vision4Press platform.
Data correspond to usage on the plateform after 2015. The current usage metrics is available 48-96 hours after online publication and is updated daily on week days.
Initial download of the metrics may take a while.