Fig. A.1
Download original image
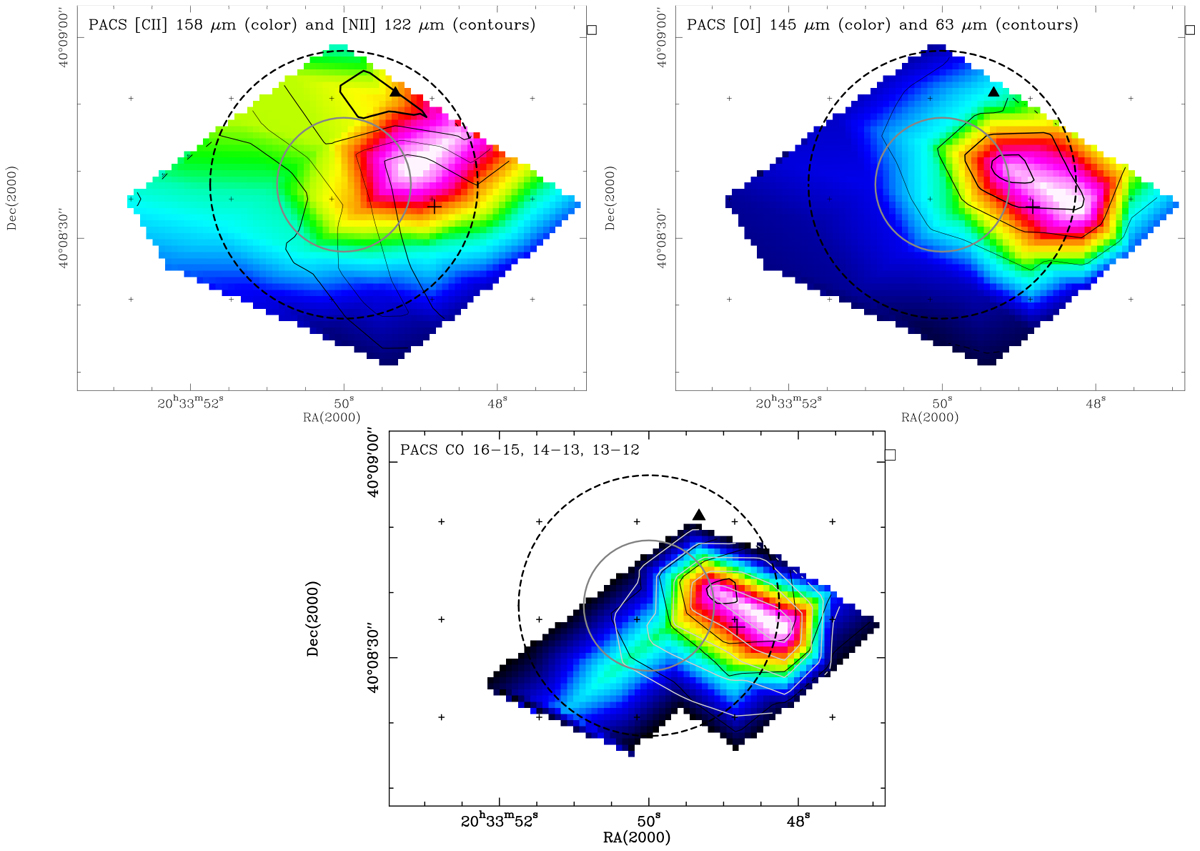
Various overlays of PDR lines observed with PACS. The colour range for the PACS [C II] data (top left) is 20 to 211 K km s−1, contours (1, 2, 3, 4 K km s−1) of [N II] emission are overlaid. The colour range for the PACS [O I] 145 μm data (top right) is 0 to 85 K km s−1, contours (10, 50, 90, 130, 170 K km s−1) of PACS [O I] 63 μm emission are overlaid. The colour range for the PACS CO 13→12 data (bottom) is 0 to 16 K km s−1, black contours (1, 4, 7, 11 K km s−1) of PACS CO 16→15 emission, and grey contours (5 to 25 by 5 K km s−1) of PACS CO 14→13 emission are overlaid. The ’finger’ of emission in CO 13→12 emission is probably an artefact since it is not visible in the CO 16→15 and 14→13 lines. The black triangle indicates the double system (Star A) of which at least one is a Herbig Be star, the white rectangle points to Star B with a B0.5 B1.5 spectral type, and the large black cross marks Star C, aresolved binary of which one is late O or early B star. The solid grey circle has a size of 20″ and the dashed one of 40″. This is the position for the flux determination for PDR modelling.
Current usage metrics show cumulative count of Article Views (full-text article views including HTML views, PDF and ePub downloads, according to the available data) and Abstracts Views on Vision4Press platform.
Data correspond to usage on the plateform after 2015. The current usage metrics is available 48-96 hours after online publication and is updated daily on week days.
Initial download of the metrics may take a while.