Fig. 13
Download original image
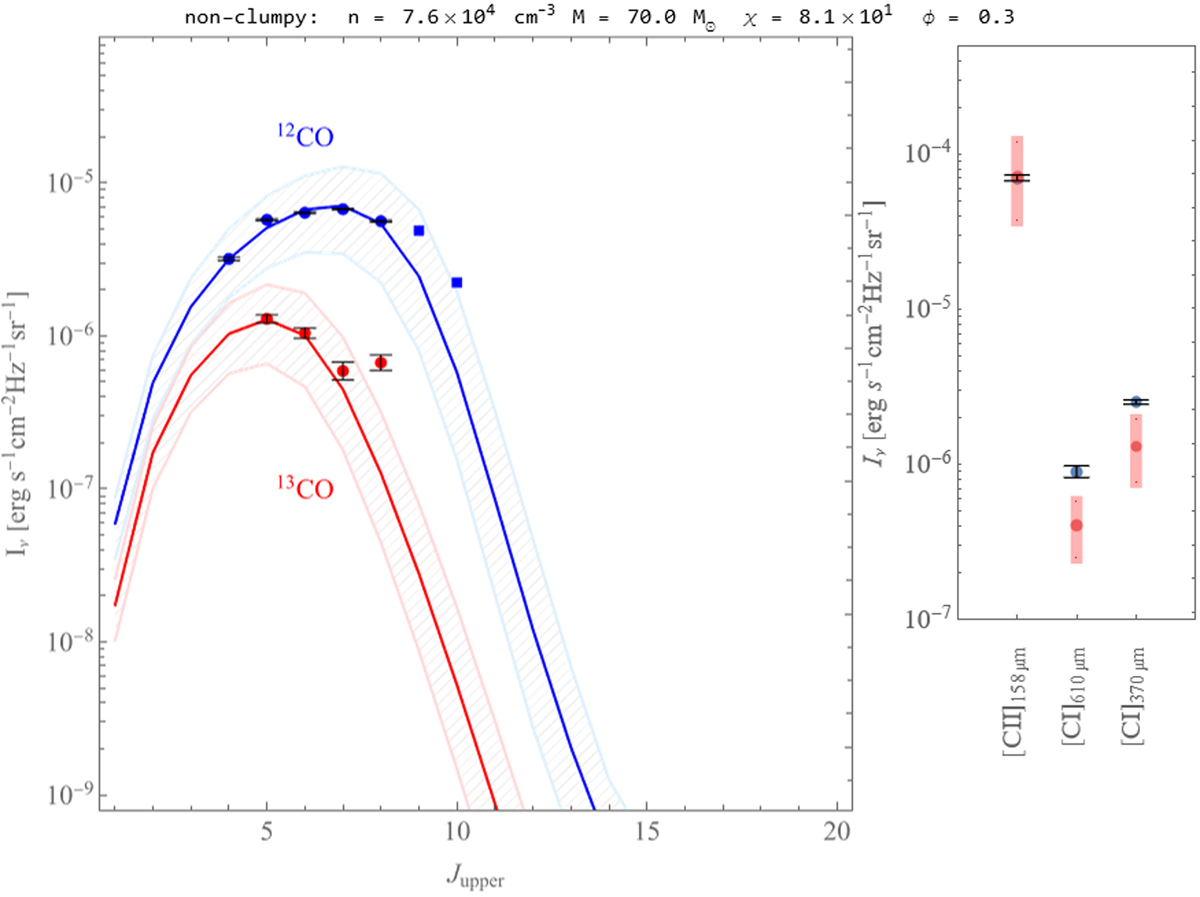
PDR model results of the non-clumpy globule tail model. Left panel: 12CO (blue points and line) and 13CO (red points and line) model SLED (spectral line energy distribution). This is the best-fitting non-clumpy model. The colour-shaded areas give the range of models by varying all parameters by ± 20%. Right panel: observed (blue) and modelled (red) fine-structure line fluxes for this model, with the model variations indicated by the vertical red bands. Data points without error bars, namely, the two highest-J 12CO lines J = 10→9 and 9→8), are excluded from the fit, but shown to provide further information.
Current usage metrics show cumulative count of Article Views (full-text article views including HTML views, PDF and ePub downloads, according to the available data) and Abstracts Views on Vision4Press platform.
Data correspond to usage on the plateform after 2015. The current usage metrics is available 48-96 hours after online publication and is updated daily on week days.
Initial download of the metrics may take a while.