Fig. 12
Download original image
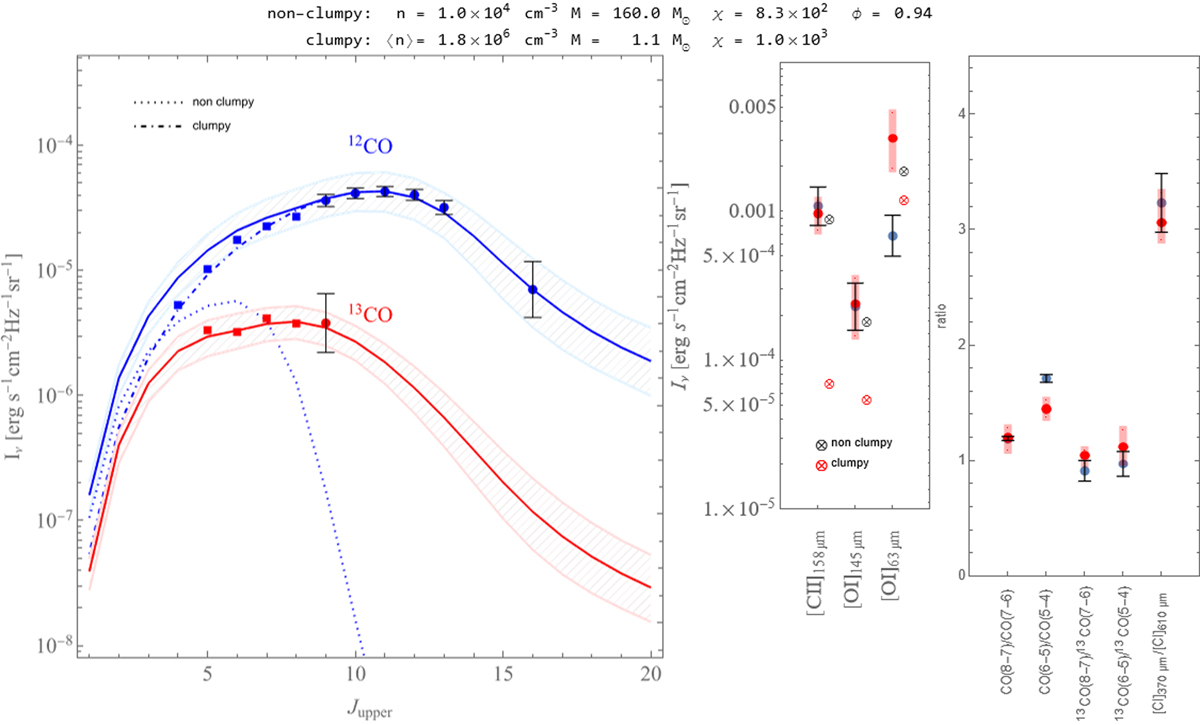
PDR model results of the two-component globule model. Left panel: 12CO (blue lines) and 13CO (red lines) model SLED (spectral line energy distribution) together with the observed data (blue for 12CO and red for 13CO, respectively). We note that data points without error bars are excluded from the fit but are shown as a consistency check. The non-clumpy and clumpy contribution to the total SLED are displayed with dotted and dash-dotted lines, respectively. The hatched areas around the SLED’s indicate the model sensitivity to 20% variations of the model parameters. Centre panel: fine-structure line data. We note that the [O I] 63 μm line was excluded from the fit. The blue dots (with error bars) are the observations and the red dots are the model derived values with the red bands indicating the model response to 20% parameter variations, For each line intensity, we show forinformation their contribution from the non-clumpy and clumpy components with black and red crossed circles, respectively (with a slight offset to the right for easier reading). Right panel: behavior of the various line ratios with the same coding.
Current usage metrics show cumulative count of Article Views (full-text article views including HTML views, PDF and ePub downloads, according to the available data) and Abstracts Views on Vision4Press platform.
Data correspond to usage on the plateform after 2015. The current usage metrics is available 48-96 hours after online publication and is updated daily on week days.
Initial download of the metrics may take a while.