Fig. 11
Download original image
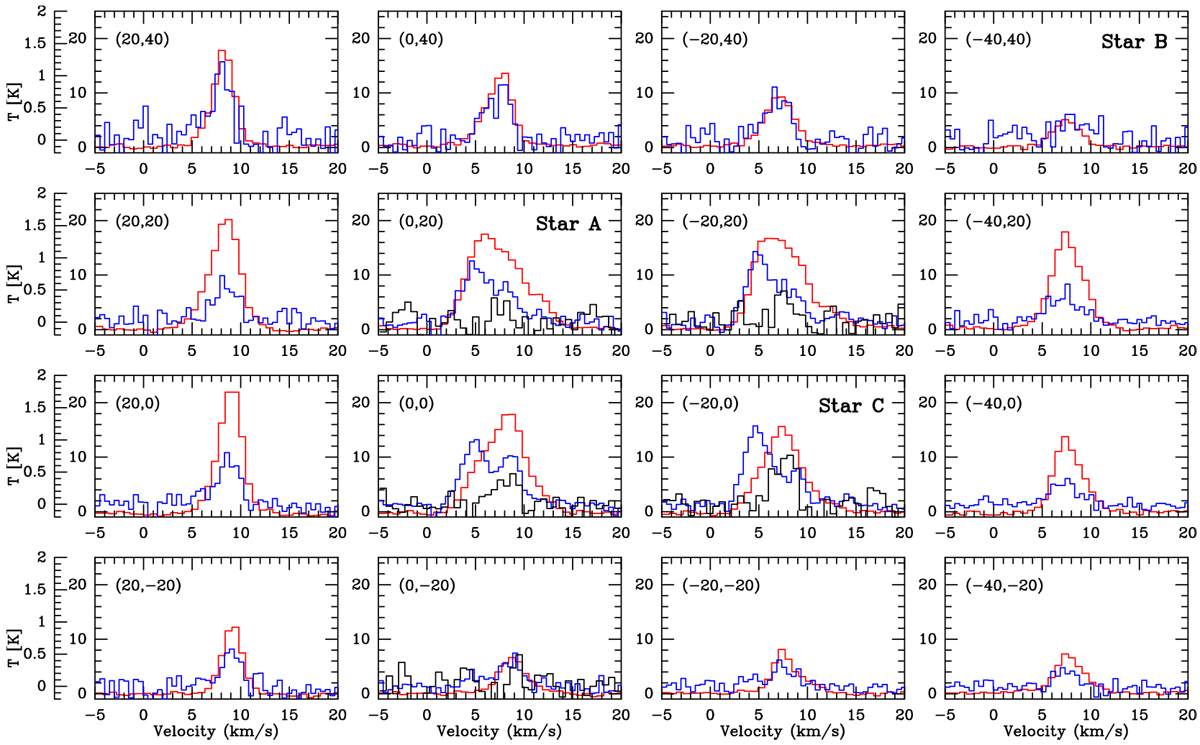
Spectral maps of the [O I] 63 μm line (blue), the [C II] 158 μm line (red) and the CO 16→15 line (black) of the globule head in the velocity range −5 to 20 km s−1. The leftmostmain beam brightness temperature scale ranges from −0.2 to 2 K and is valid for [O I] and CO 16→15. The temperature scales at each panel are valid for [C II]. All data are smoothed to an angular resolution of 20″ and sampledon a grid of 20″ in order to increase the S/N. However, the CO 16→15 line was not observed at all positions (Sect. 2) so that we only plot the few spectra with observed emission above the 5σ level. The velocity resolution is 0.5, 0.7, and 0.6 km s−1 for [O I], [C II], and CO 16→15, respectively. The map centre position is RA(2000) = 20h33m50s, Dec(2000) = 40°08′36″. The approximate locations of the star systems are indicated.
Current usage metrics show cumulative count of Article Views (full-text article views including HTML views, PDF and ePub downloads, according to the available data) and Abstracts Views on Vision4Press platform.
Data correspond to usage on the plateform after 2015. The current usage metrics is available 48-96 hours after online publication and is updated daily on week days.
Initial download of the metrics may take a while.