Fig. 10
Download original image
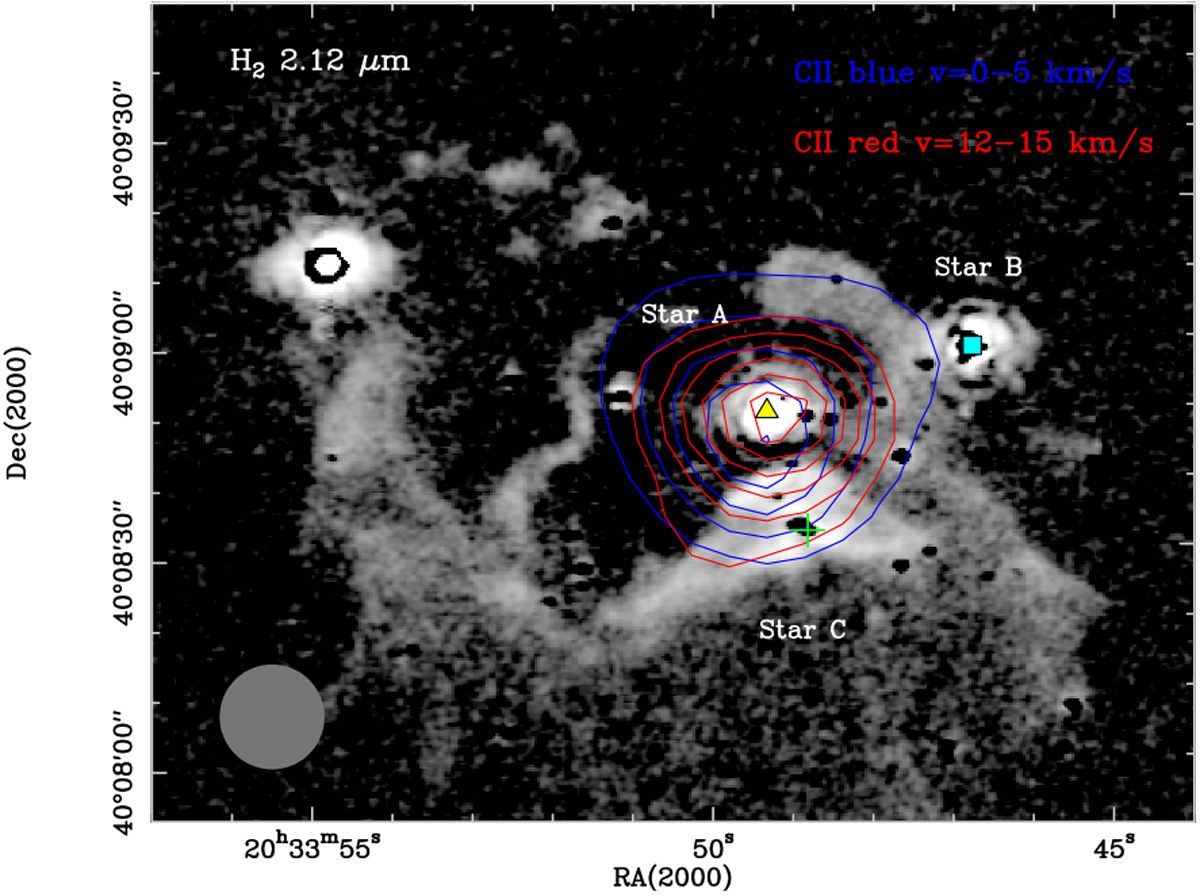
Map of H2 2.12 μm emission (Djupvik et al. 2017) with contours of [C II] outflow emission. The blue velocity range of the [C II] line ranges from 0 to 5 km s−1, contours go from 10 to 50 by 10 K km s−1. The red velocity range is 12–15 km s−1 and contoursgo from 3 to 13 by 2 K km s−1. The embedded stars and the [C II] beam size are indicated.
Current usage metrics show cumulative count of Article Views (full-text article views including HTML views, PDF and ePub downloads, according to the available data) and Abstracts Views on Vision4Press platform.
Data correspond to usage on the plateform after 2015. The current usage metrics is available 48-96 hours after online publication and is updated daily on week days.
Initial download of the metrics may take a while.