Fig. 5
Download original image
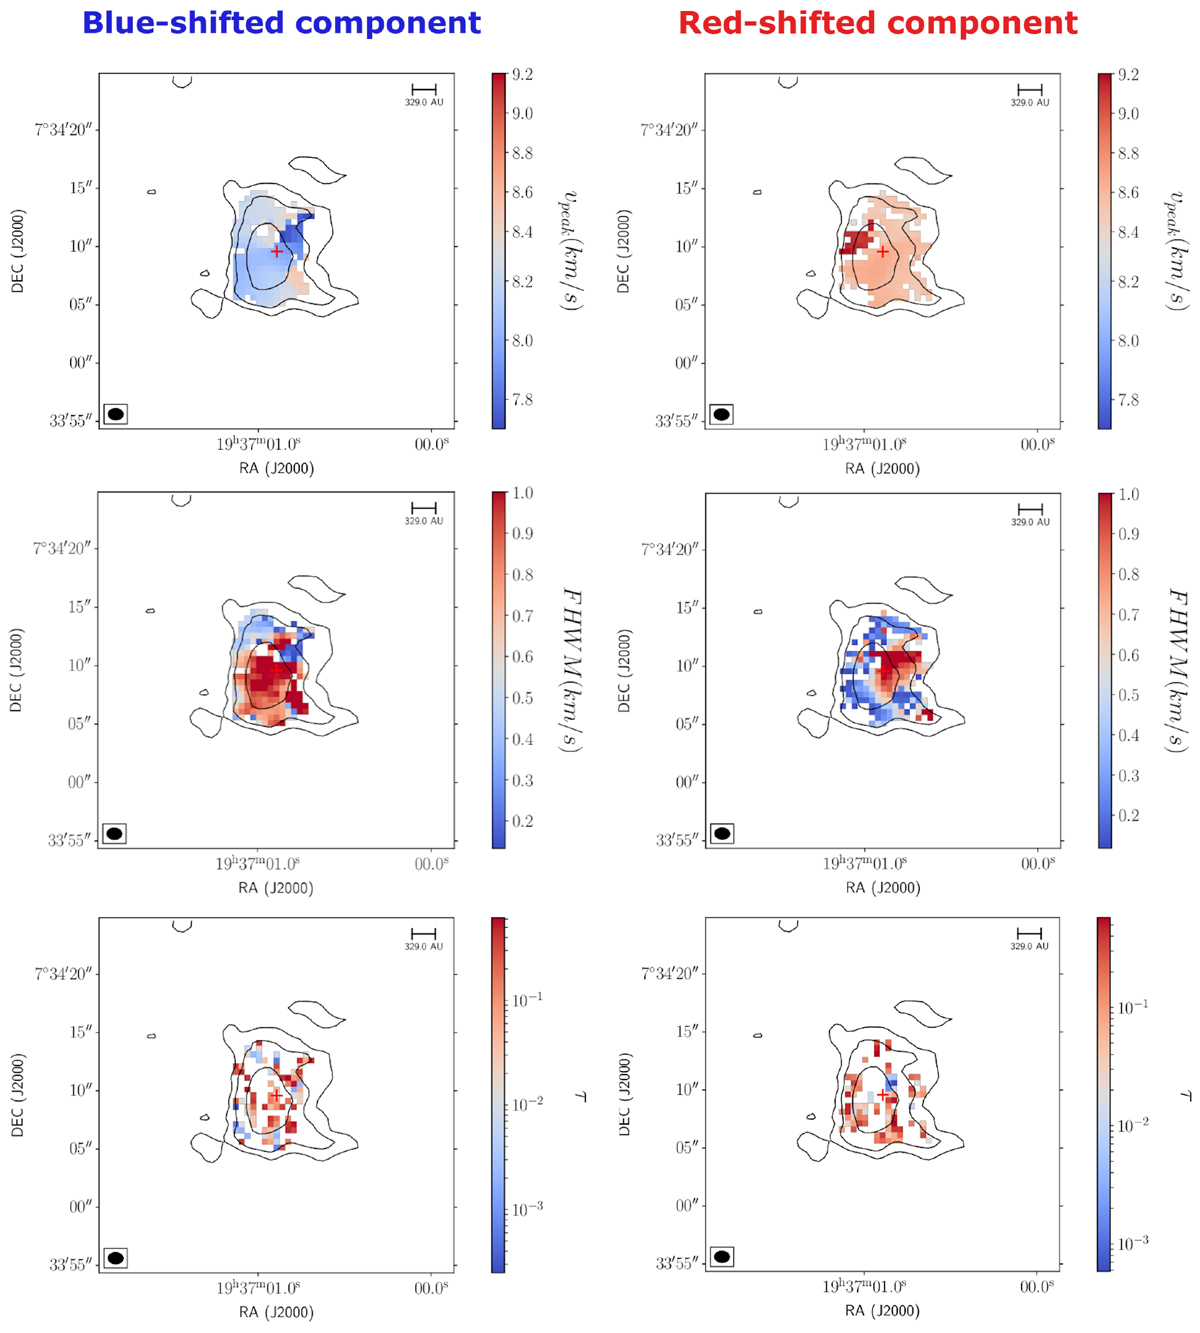
C17O (1–0) maps obtained from modeling the line profiles with two velocity components. Overlaid contours show the integrated intensity at 5, 10, 20 and 30σ, where σ is 10.0 mJy beam−1. Top: peak velocity. Middle: linewidt. Bottom: opacity. Each column shows one of the two velocity components. Red crosses indicate the centroid position of B335.
Current usage metrics show cumulative count of Article Views (full-text article views including HTML views, PDF and ePub downloads, according to the available data) and Abstracts Views on Vision4Press platform.
Data correspond to usage on the plateform after 2015. The current usage metrics is available 48-96 hours after online publication and is updated daily on week days.
Initial download of the metrics may take a while.