Fig. 3
Download original image
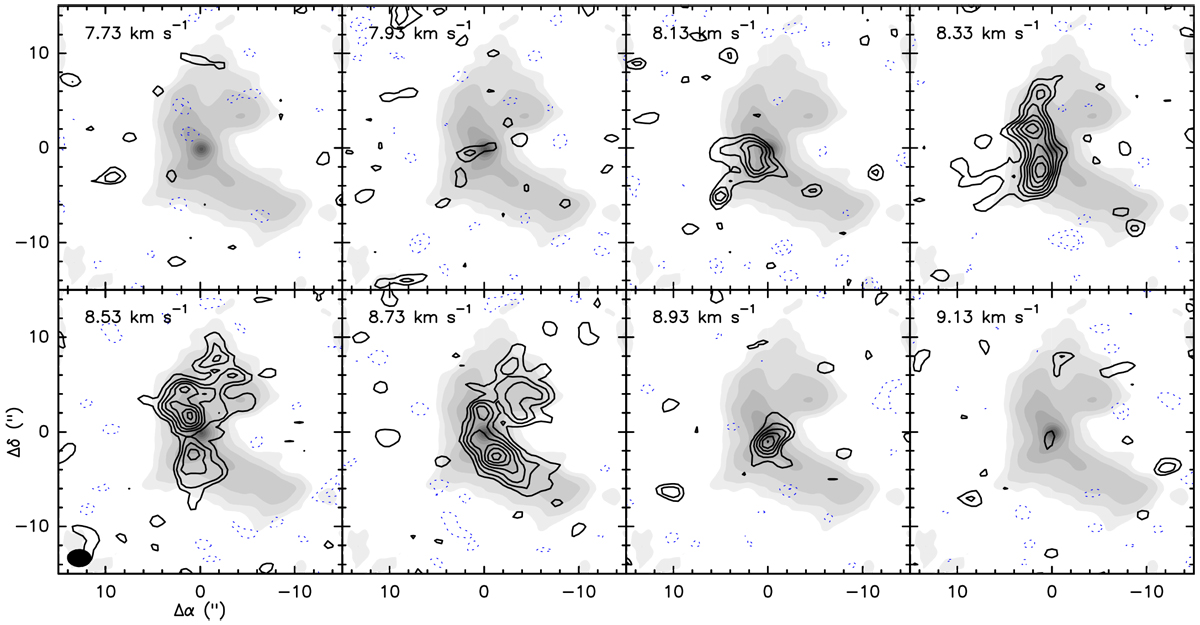
Contour channel maps of the emission of the F = 5/2–(−5/2) hyperfine component of the C17O J = 1–0 transition,overlapped with the gray scale image of the 1.3 mm dust emission. Contours are − 4, − 2, and from 2 to 18 by steps of 2σ, where σ is 10 mJy beam−1. The synthesized beam is shown in the bottom left panel as a filled ellipse. The vLSR channel velocities are shown in the top left part of the panels.
Current usage metrics show cumulative count of Article Views (full-text article views including HTML views, PDF and ePub downloads, according to the available data) and Abstracts Views on Vision4Press platform.
Data correspond to usage on the plateform after 2015. The current usage metrics is available 48-96 hours after online publication and is updated daily on week days.
Initial download of the metrics may take a while.