Fig. 1
Download original image
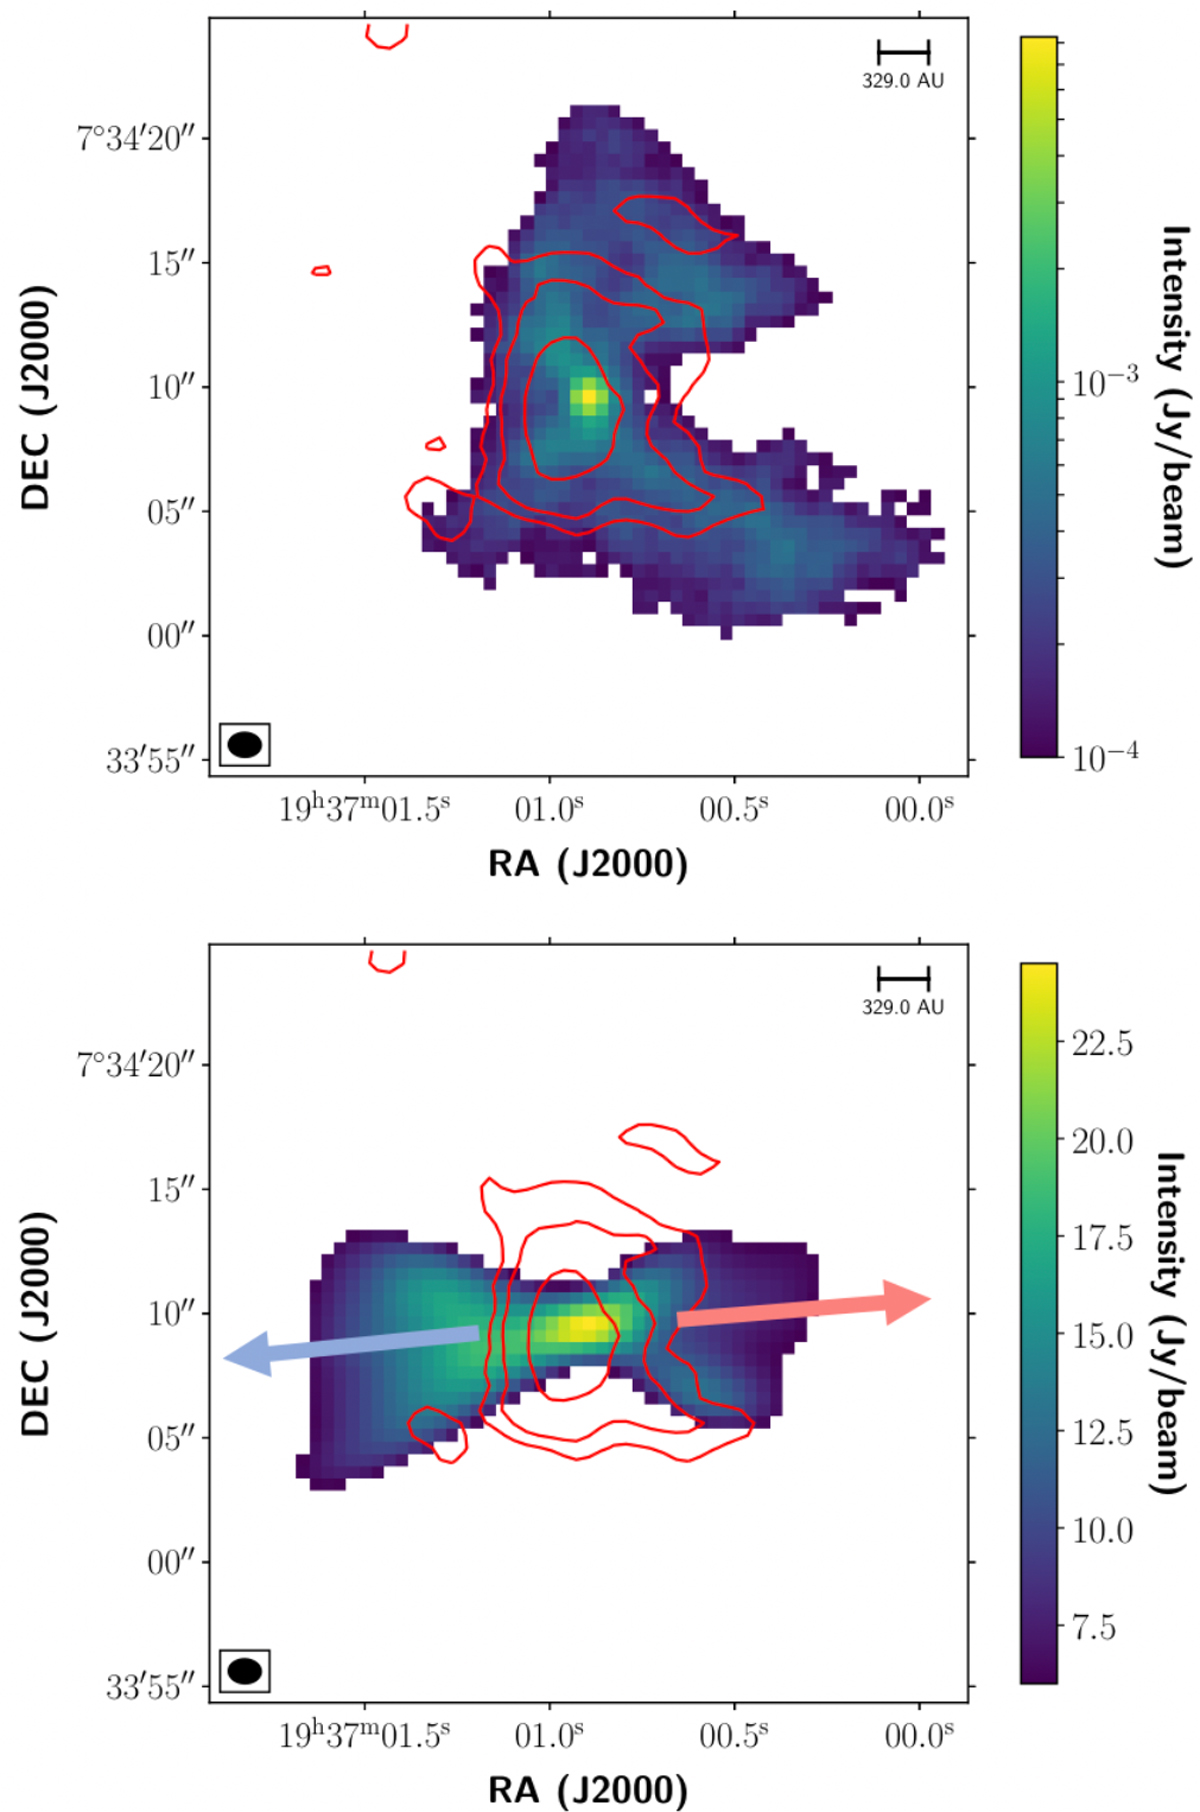
Red contours showing moment 0 of C17O emission, integrated over the velocity range 4.8–6.2 km s−1 and 7.6–9.4 km s−1. Contours show emission at −3, 3, 5, 10 and 30σ, where σ is 10.0 mJy beam−1. Top: intensity shows dust continuum emission map at 110 GHz for emission over 3σ, where σ is 8.56 × 10⁻² mJy beam−1. Bottom: intensity shows 12CO (2–1) moment 0 emission integrated over the velocity range 1.4–16.2 km s−1, for emission over 3σ, where σ is 2016.9 mJy beam−1. The two arrows show the direction of the E-W outflow.
Current usage metrics show cumulative count of Article Views (full-text article views including HTML views, PDF and ePub downloads, according to the available data) and Abstracts Views on Vision4Press platform.
Data correspond to usage on the plateform after 2015. The current usage metrics is available 48-96 hours after online publication and is updated daily on week days.
Initial download of the metrics may take a while.