Free Access
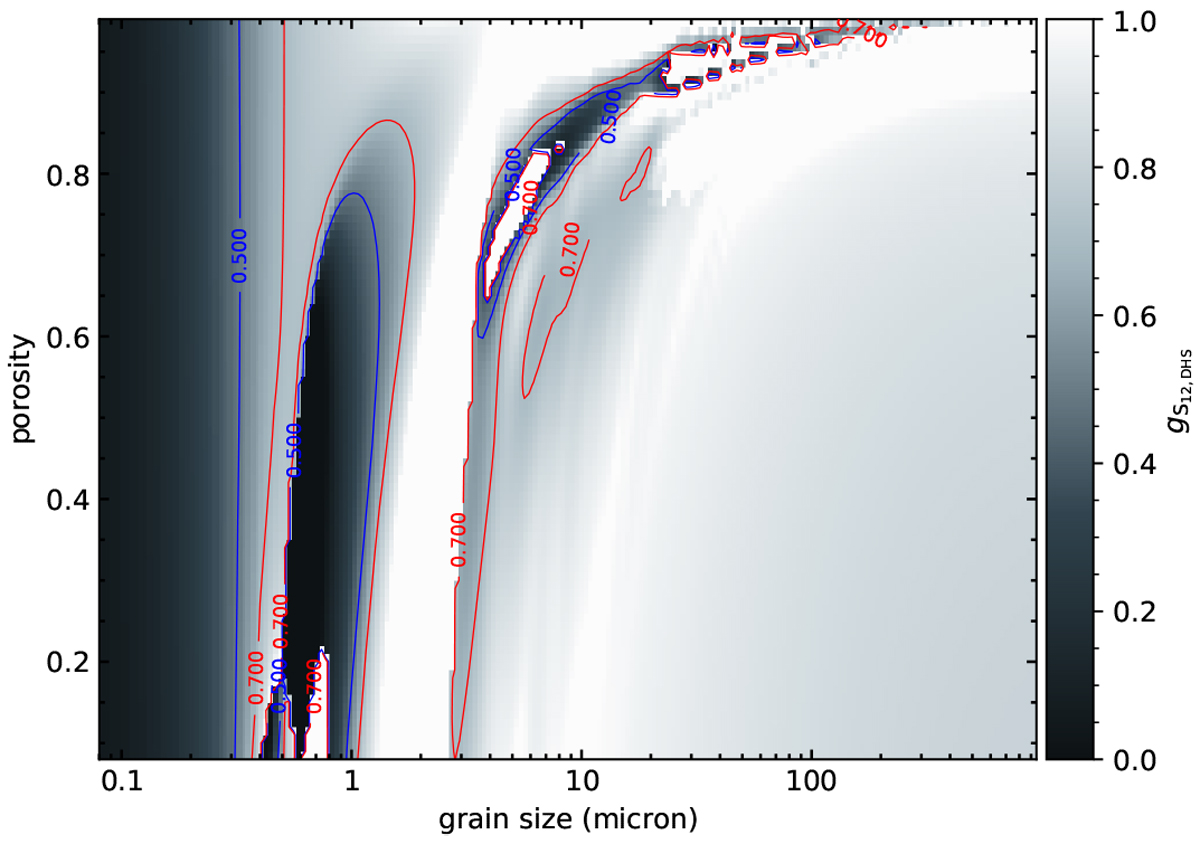
Fig. 7
Download original image
2D map of the anisotropic scattering factor ![]() computed at each point of the grain-size, porosity parameter grid with the DHS model. The contours for
computed at each point of the grain-size, porosity parameter grid with the DHS model. The contours for
![]() (blue lines) and
(blue lines) and ![]() (red lines) indicate the range of scattering factors from our best-fit disk model with the HG approximation.
(red lines) indicate the range of scattering factors from our best-fit disk model with the HG approximation.
Current usage metrics show cumulative count of Article Views (full-text article views including HTML views, PDF and ePub downloads, according to the available data) and Abstracts Views on Vision4Press platform.
Data correspond to usage on the plateform after 2015. The current usage metrics is available 48-96 hours after online publication and is updated daily on week days.
Initial download of the metrics may take a while.