Fig. E.1
Download original image
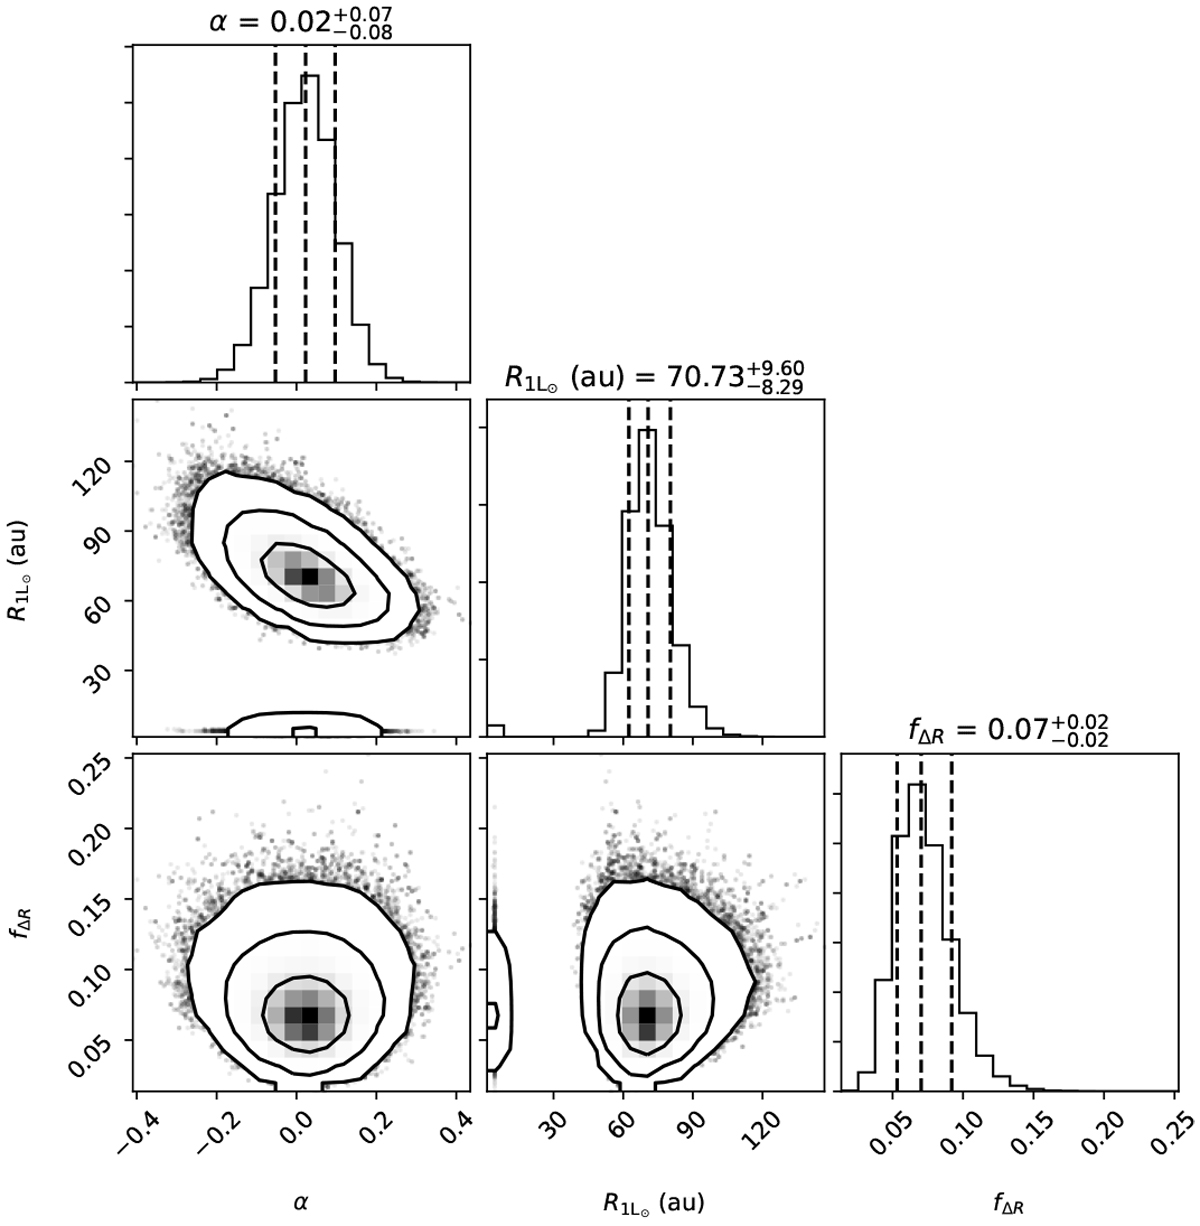
Projected posterior distribution and density plots of the free parameter (slope α, intercept ![]() , and fractional intrinsic scatter fΔR) of the power law fitted to the sample data points. The plot additionally shows the 50 %, 16 %, and 84 % quartiles (vertical dashed lines), representing the distribution median and the 1 σ uncertainties (lower and upper bound), respectively. The 1D histograms represent the probability distributions of each parameter marginalized over the other two. The contour maps represent the central 68.3%, 95.5%, and 99.73% of the 2D probability distributions of different pairs of parameters, marginalized over the third.
, and fractional intrinsic scatter fΔR) of the power law fitted to the sample data points. The plot additionally shows the 50 %, 16 %, and 84 % quartiles (vertical dashed lines), representing the distribution median and the 1 σ uncertainties (lower and upper bound), respectively. The 1D histograms represent the probability distributions of each parameter marginalized over the other two. The contour maps represent the central 68.3%, 95.5%, and 99.73% of the 2D probability distributions of different pairs of parameters, marginalized over the third.
Current usage metrics show cumulative count of Article Views (full-text article views including HTML views, PDF and ePub downloads, according to the available data) and Abstracts Views on Vision4Press platform.
Data correspond to usage on the plateform after 2015. The current usage metrics is available 48-96 hours after online publication and is updated daily on week days.
Initial download of the metrics may take a while.