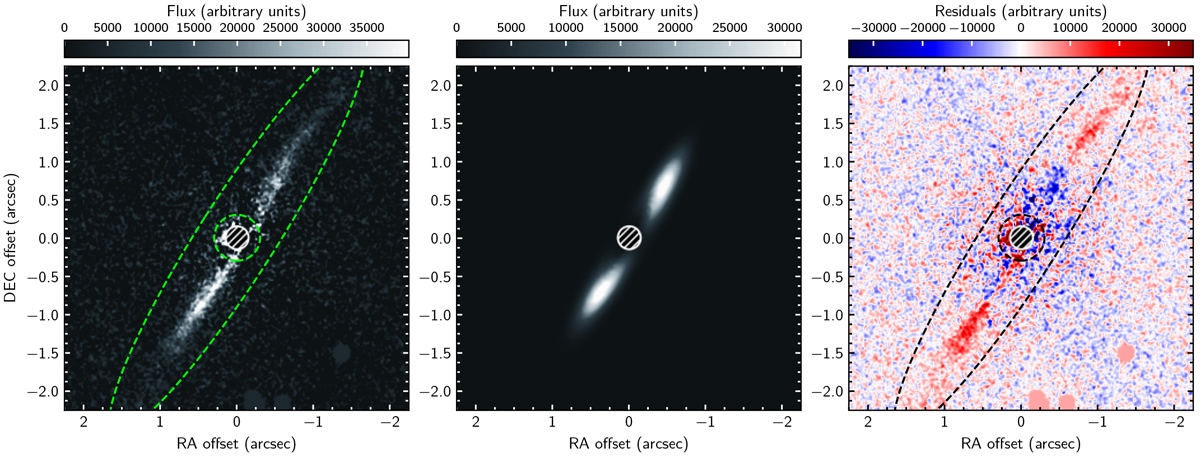
Fig. D.1
Download original image
Observation and model images for GSC 07396-00759. Shown from left to right are the measured Qϕ, best-fit model, and residual image obtained from our disk model using a linear scaling for each panel. The regions outside of the ellipse and within the circle (dashed green lines) are excluded from the χ2 calculation. The coronagraphic mask is indicated by the (shaded) circular region in each panel. North is to the top and east to left in each panel.
Current usage metrics show cumulative count of Article Views (full-text article views including HTML views, PDF and ePub downloads, according to the available data) and Abstracts Views on Vision4Press platform.
Data correspond to usage on the plateform after 2015. The current usage metrics is available 48-96 hours after online publication and is updated daily on week days.
Initial download of the metrics may take a while.