Fig. C.1
Download original image
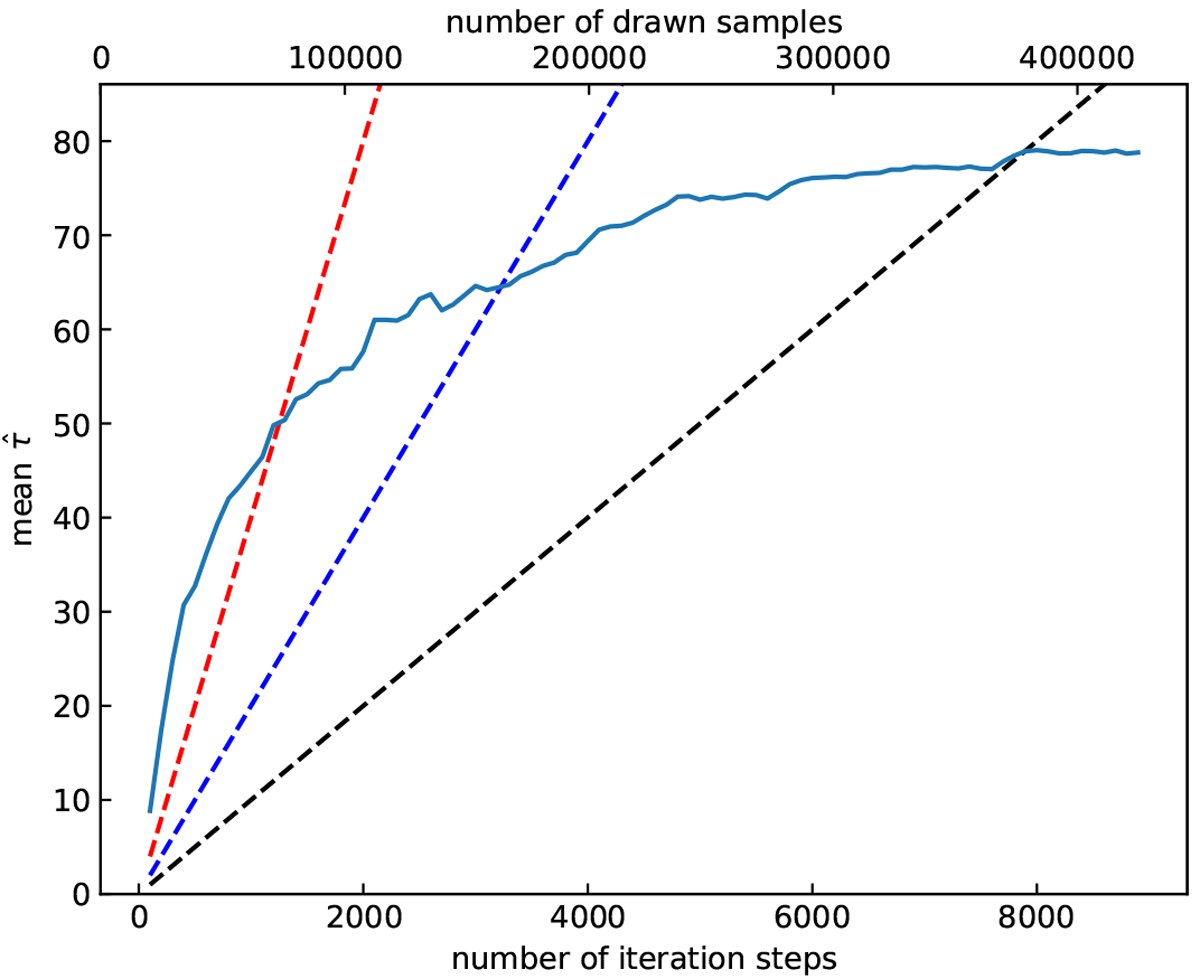
Autocorrelation time as a function of MCMC iteration steps. The estimated average autocorrelation time ![]() is shown in blue (solid line). Also shown are the
is shown in blue (solid line). Also shown are the ![]() (red), Niter∕50 (blue), and Niter∕100 (black) lines to indicate different possible levels of acceptance for the model parameter estimates. For this work, the model is consideredconverged if
(red), Niter∕50 (blue), and Niter∕100 (black) lines to indicate different possible levels of acceptance for the model parameter estimates. For this work, the model is consideredconverged if ![]() and the change in consecutive estimated autocorrelation times τ is less than 1%.
and the change in consecutive estimated autocorrelation times τ is less than 1%.
Current usage metrics show cumulative count of Article Views (full-text article views including HTML views, PDF and ePub downloads, according to the available data) and Abstracts Views on Vision4Press platform.
Data correspond to usage on the plateform after 2015. The current usage metrics is available 48-96 hours after online publication and is updated daily on week days.
Initial download of the metrics may take a while.