Fig. 10
Download original image
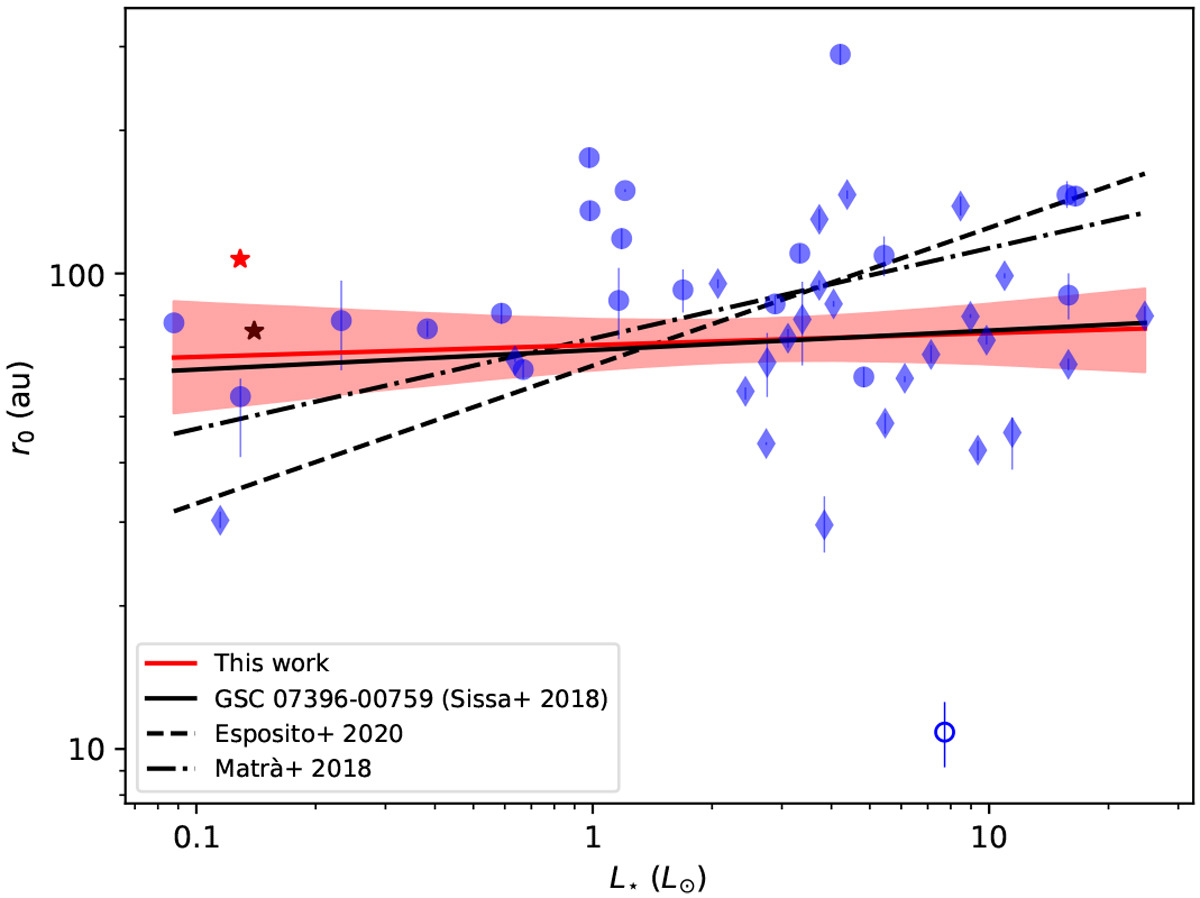
Scattered light disk radii as a function of the stellar luminosity. Shown are the best-fit power-law function, as a solid red line, and the 1σ confidence interval drawn from the corresponding probability distributions. Data points that are also part of the sample analyzed byEsposito et al. (2020) are marked as diamonds. Similar to Esposito et al. (2020), we excluded HR 7012 (blue open circle) from the fit as an outlier. The best-fit result using the radius estimate by Sissa et al. (2018) (black star) is plotted as solid black line. Also shown for comparison are the radius-luminosity power laws for planetesimal belt central radii from thermal light imaging by Matrà et al. (2018) (dash-dotted line) and the GPIES-detected disks in scattered light by Esposito et al. (2020) (dashed line).
Current usage metrics show cumulative count of Article Views (full-text article views including HTML views, PDF and ePub downloads, according to the available data) and Abstracts Views on Vision4Press platform.
Data correspond to usage on the plateform after 2015. The current usage metrics is available 48-96 hours after online publication and is updated daily on week days.
Initial download of the metrics may take a while.