Fig. 1
Download original image
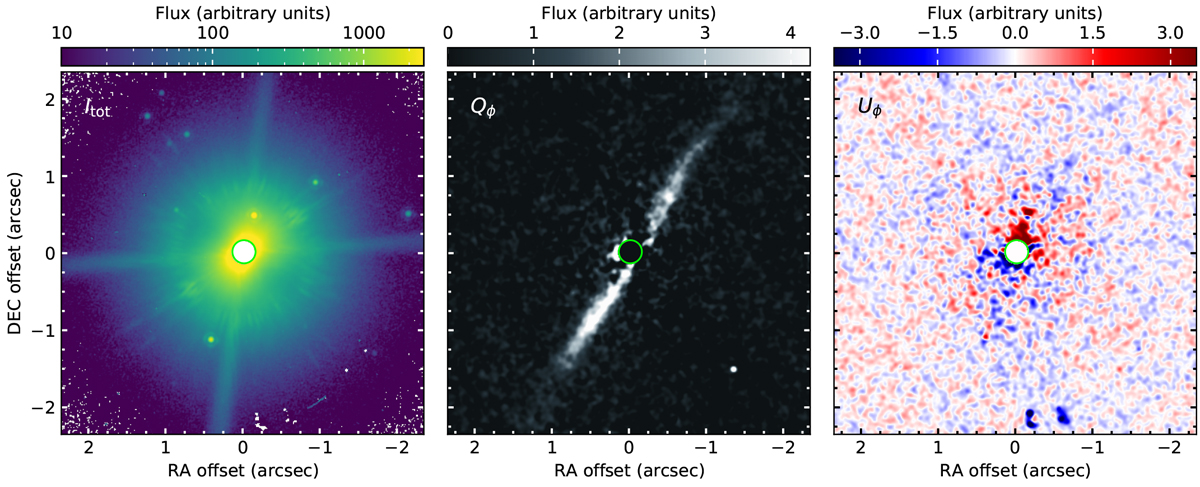
SPHERE/IRDIS polarimetric imaging observations of GSC 07396-00759. Shown from left to right are the total intensity Itot (log stretch) and the Qϕ and Uϕ images (both in linear stretch). The Qϕ and Uϕ images were convolved with a Gaussian point spread function (σ = 2 pixel) to increase the visibility in this plot. The coronagraphic mask is indicated by the green circular region in each panel. North is to the top and east to the left in each panel. It should be noted that the disk is not visible in the total intensity image (left panel). The structure appearing to extend from the NW to the SE is a point spread function artifact.
Current usage metrics show cumulative count of Article Views (full-text article views including HTML views, PDF and ePub downloads, according to the available data) and Abstracts Views on Vision4Press platform.
Data correspond to usage on the plateform after 2015. The current usage metrics is available 48-96 hours after online publication and is updated daily on week days.
Initial download of the metrics may take a while.