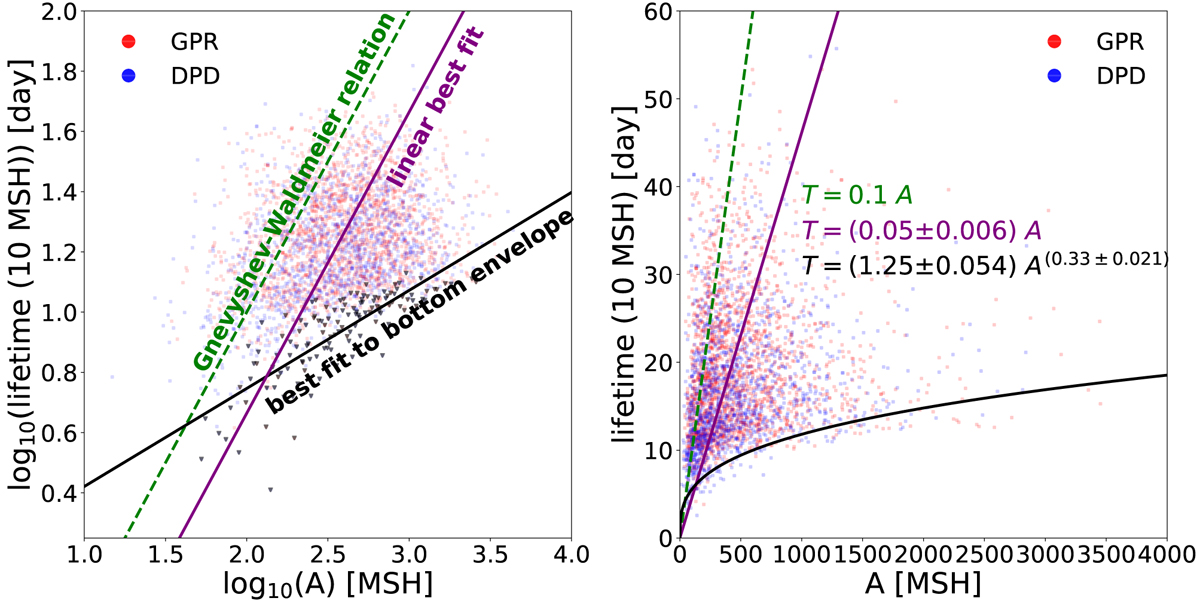
Fig. 8.
Download original image
Lifetime of sunspot groups in terms of their area. Left panel: logarithmic values of the lifetime and the area, right panel: their linear values. The dashed green line denotes the variation that corresponds to the Gnevyshev-Waldmeier rule, the purple solid line shows the best linear fit based on our data, while the black solid curve represents the lower envelop. The envelop curve has been obtained by fitting the groups shown by dark triangles. The errors shown in the equation of curves were derived from the standard deviation values.
Current usage metrics show cumulative count of Article Views (full-text article views including HTML views, PDF and ePub downloads, according to the available data) and Abstracts Views on Vision4Press platform.
Data correspond to usage on the plateform after 2015. The current usage metrics is available 48-96 hours after online publication and is updated daily on week days.
Initial download of the metrics may take a while.