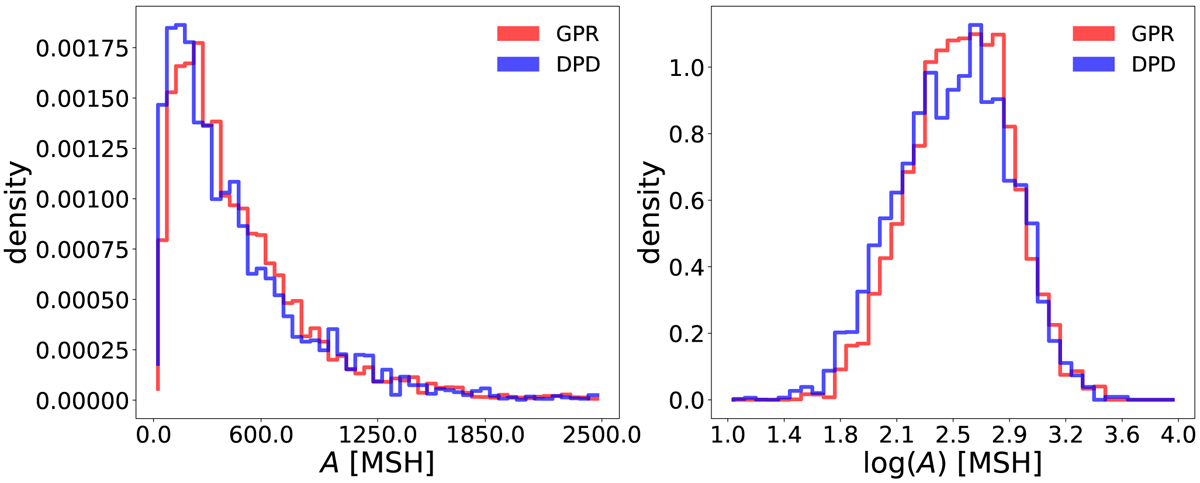
Fig. 5.
Download original image
Normalised histograms of the parameter A of the fitted model of all MC realizations for every sunspot groups of each dataset. Left-hand panel: the histogram is shown in linear scale, while on the right we plot the distribution of the logarithm of the groups’ area since this allows better visualisation of small and large values. The histograms for the GPR and DPD are in general consistent, however small differences are visible for particular ranges of sunspots’ areas.
Current usage metrics show cumulative count of Article Views (full-text article views including HTML views, PDF and ePub downloads, according to the available data) and Abstracts Views on Vision4Press platform.
Data correspond to usage on the plateform after 2015. The current usage metrics is available 48-96 hours after online publication and is updated daily on week days.
Initial download of the metrics may take a while.