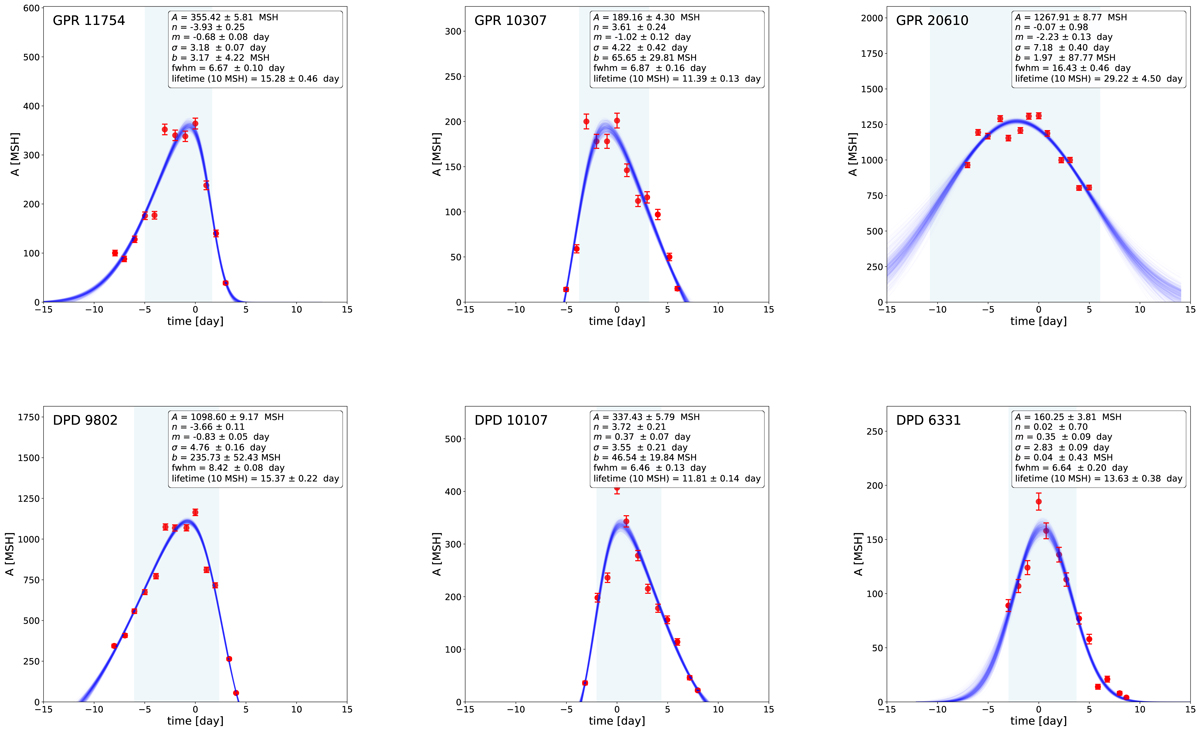
Fig. 3.
Download original image
GPR/DPD solar groups for negative/positive n and a symmetric evolution (n ≈ 0), as a representative example. The observed variations of the area with time are shown by red dots, while the fitting curves are represented by the blue lines for 500 MCMC realisations. The time on the horizontal axis is relative to the epoch of observed maximum. The error estimates of sunspots group area are calculated using Eq. (16). The quantities displayed in the legend of the left-hand side of plots show the modes (most probable values) of the marginal posterior probability distributions of the model parameters and the associated errors. The background light-blue vertical strips mark the full width at half maximum (FWHM) calculated at the mode of all realisations.
Current usage metrics show cumulative count of Article Views (full-text article views including HTML views, PDF and ePub downloads, according to the available data) and Abstracts Views on Vision4Press platform.
Data correspond to usage on the plateform after 2015. The current usage metrics is available 48-96 hours after online publication and is updated daily on week days.
Initial download of the metrics may take a while.