Fig. 10.
Download original image
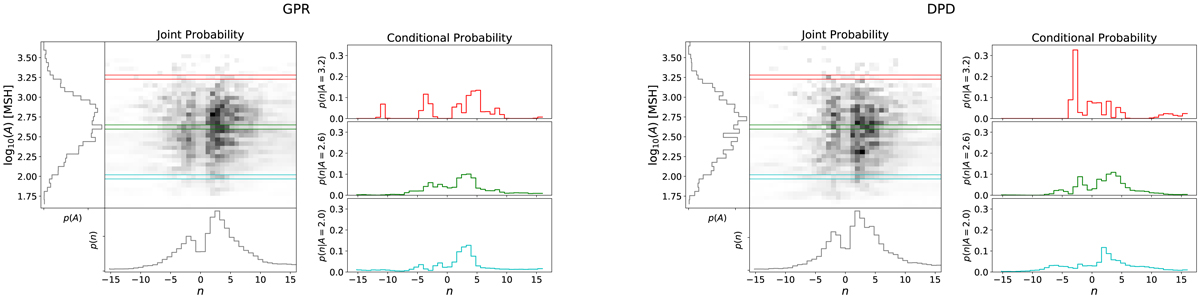
Joint probability density, p(n, A), and the conditional probability density, p(n | A), for the GPR (left-hand panel) and DPD (right-hand panel) datasets. For each dataset the central left panel shows the joint probability (the grayscale corresponds to the value of the probability), the attached distributions show the marginal distributions of the area and the skew parameter (the grey colour spectrum is proportional to the magnitude of the probability). Right panels: conditional probability at three different values of A (in the figure showing the joint probability these three values correspond to horizontal cuts in different colour).
Current usage metrics show cumulative count of Article Views (full-text article views including HTML views, PDF and ePub downloads, according to the available data) and Abstracts Views on Vision4Press platform.
Data correspond to usage on the plateform after 2015. The current usage metrics is available 48-96 hours after online publication and is updated daily on week days.
Initial download of the metrics may take a while.