Fig. 9
Download original image
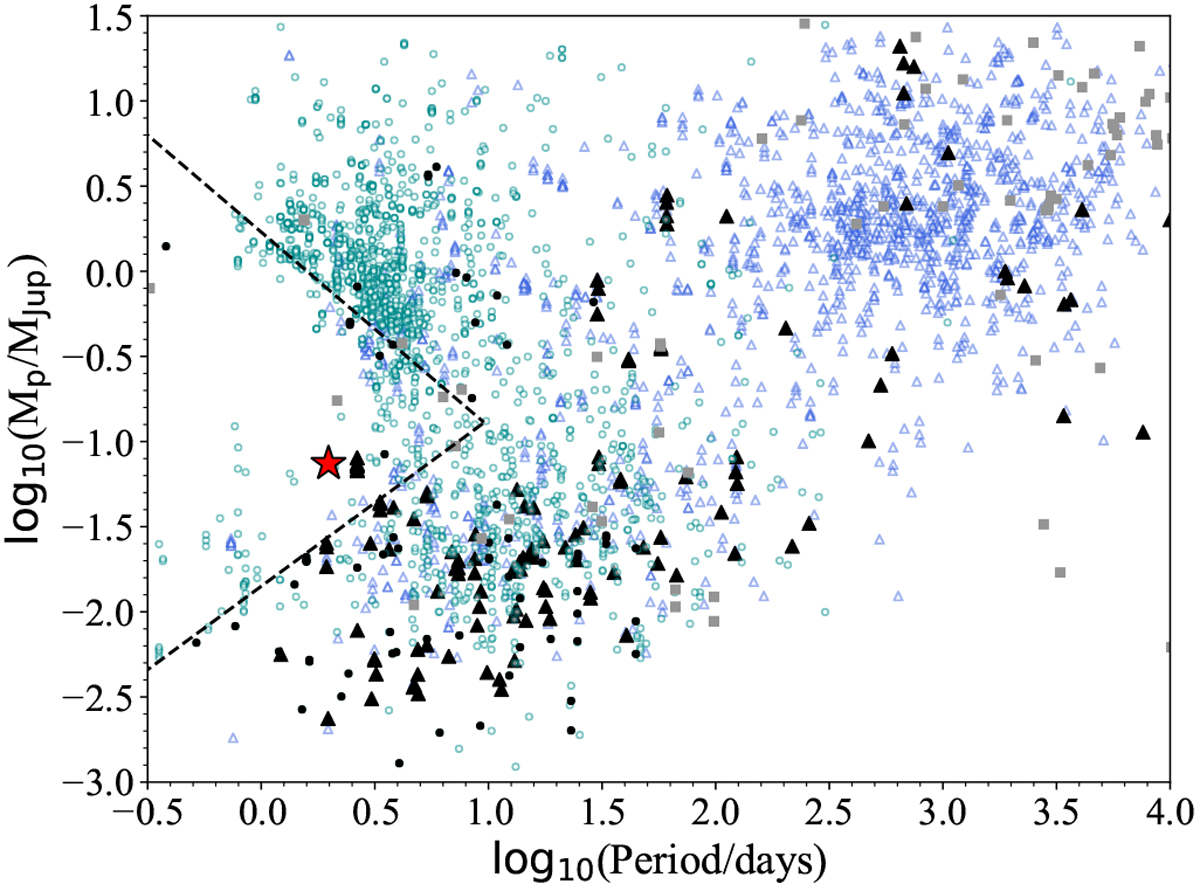
Mass vs orbital period diagram for planets with mass measurements. Shown are planets found by the transit method (light cyan circles), planets found by radial velocity measurements (blue triangles), and planets found by other methods (gray squares). The filled black symbols represent planets orbiting around M stars (i.e., stars with Teff in the range2500–4000 K), each symbol representing the discovery method as explained before. The black dashed lines represent the limits of the Neptunian desert defined by Mazeh et al. (2016). The position of TOI-674b in this diagram is shown by the red star.
Current usage metrics show cumulative count of Article Views (full-text article views including HTML views, PDF and ePub downloads, according to the available data) and Abstracts Views on Vision4Press platform.
Data correspond to usage on the plateform after 2015. The current usage metrics is available 48-96 hours after online publication and is updated daily on week days.
Initial download of the metrics may take a while.