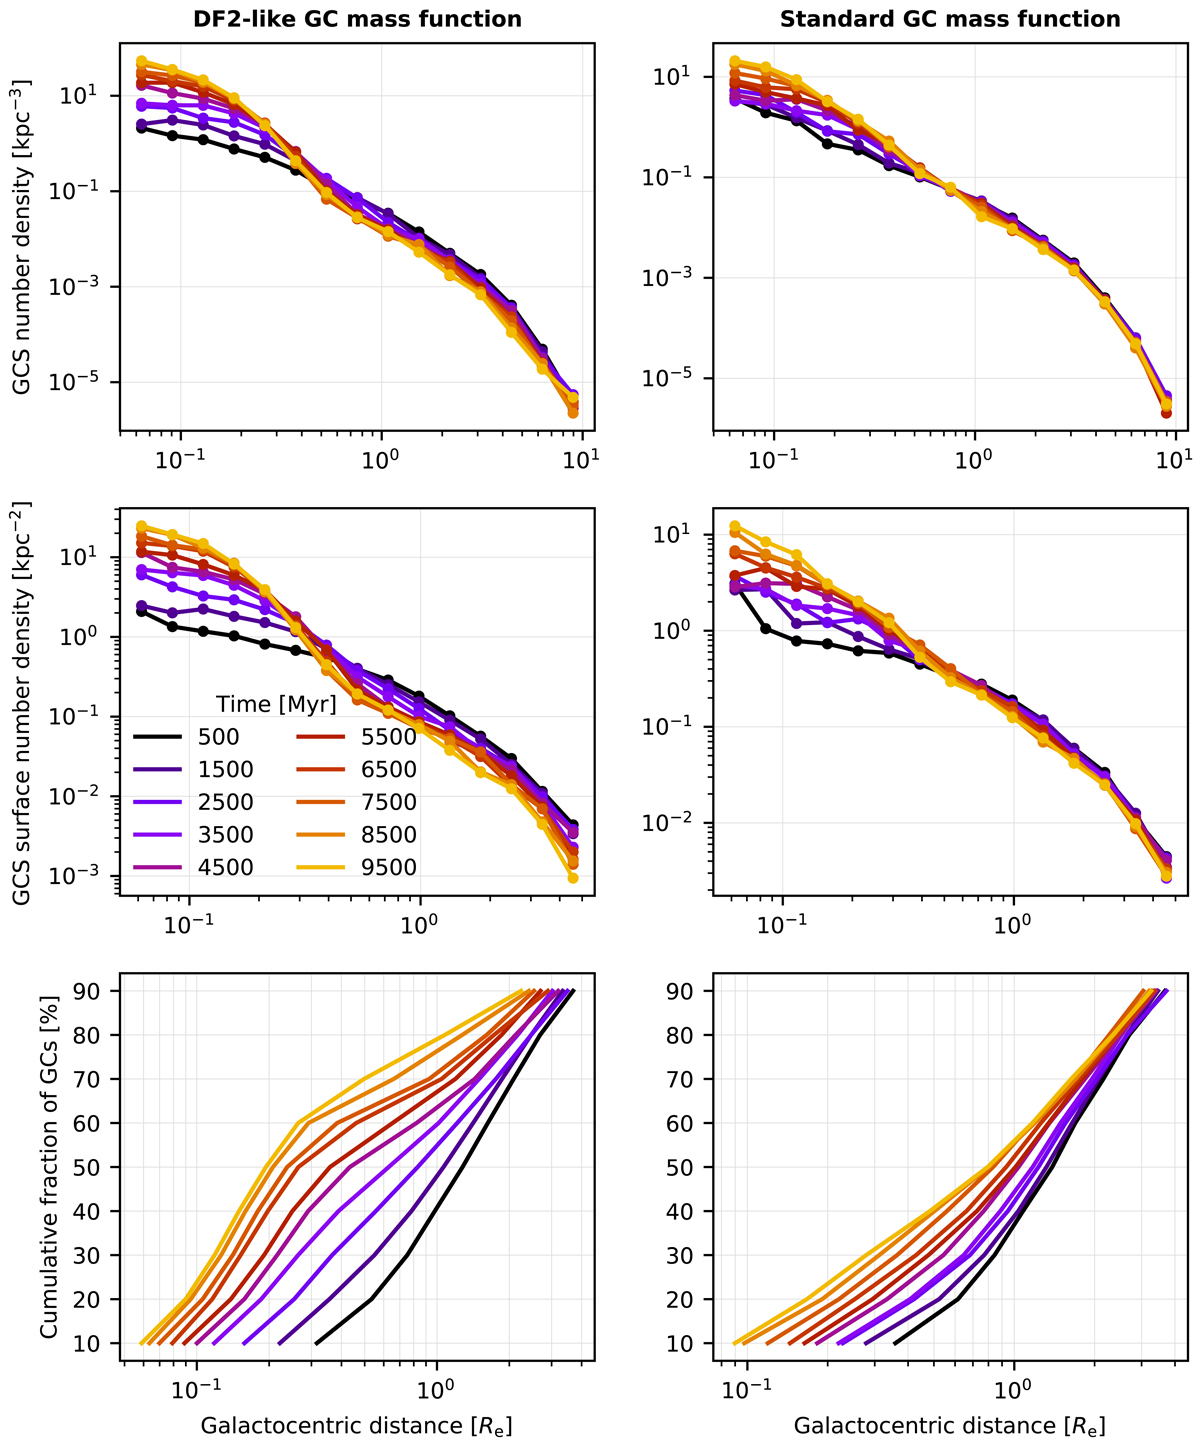
Fig. 8.
Download original image
Evolution of GC systems. Left column: simulations with 10 GCs that have the masses of those observed in DF2 (left column of Table 2). Simulations of 10 random realizations of the system were combined in these plots. Galactocentric distance is given in units of the effective radius of the galaxy (Re = 1.9 kpc). Right column: same but for GC masses set according to the standard GCLF (right column of Table 2). Top row: profiles of number density of GCs as a function of galactocentric distance. The individual lines correspond to different times since the start of the simulation. Middle row: evolution of the profile of the surface number density of GCs. Bottom row: evolution of the radial profile of the cumulative fraction of GCs.
Current usage metrics show cumulative count of Article Views (full-text article views including HTML views, PDF and ePub downloads, according to the available data) and Abstracts Views on Vision4Press platform.
Data correspond to usage on the plateform after 2015. The current usage metrics is available 48-96 hours after online publication and is updated daily on week days.
Initial download of the metrics may take a while.