Fig. 7.
Download original image
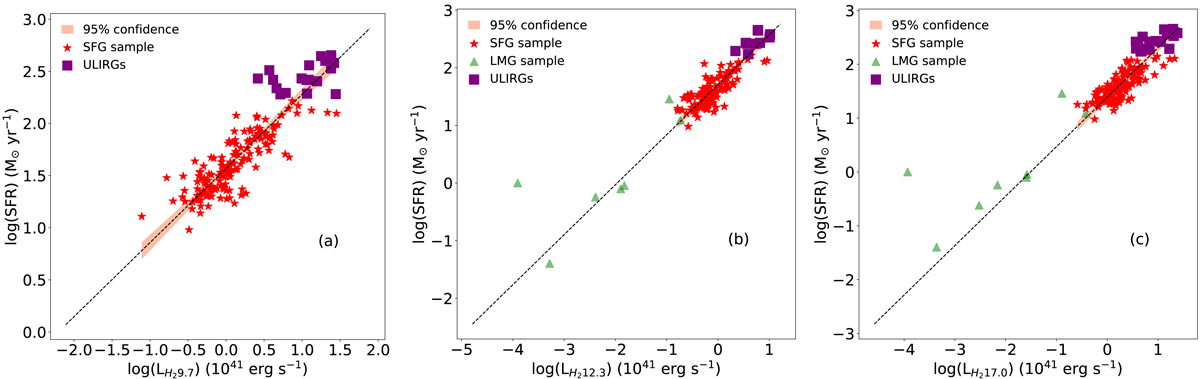
a: correlation between the H2 molecular line at 9.67 μm, expressed in units of 1041 erg s−1, and the SFR derived from the total IR luminosity (black line) for a catalogue of SFGs (red star). b: correlation between the H2 molecular line at 12.28 μm, expressed in units of 1041 erg s−1, and the SFR derived from the total IR luminosity (black line) for a catalogue of SFGs (red star). The green triangle shows LMG detection, which was not used to derive the correlation. c: correlation between the H2 molecular line at 17.03 μm, expressed in units of 1041 erg s−1, and the SFR derived from the total IR luminosity (black line) for a catalogue of SFGs (red star). In all three figures, the shaded areas show the 95% confidence interval of the relations, and the purple squares highlight the ULIRG population in the SFG sample.
Current usage metrics show cumulative count of Article Views (full-text article views including HTML views, PDF and ePub downloads, according to the available data) and Abstracts Views on Vision4Press platform.
Data correspond to usage on the plateform after 2015. The current usage metrics is available 48-96 hours after online publication and is updated daily on week days.
Initial download of the metrics may take a while.