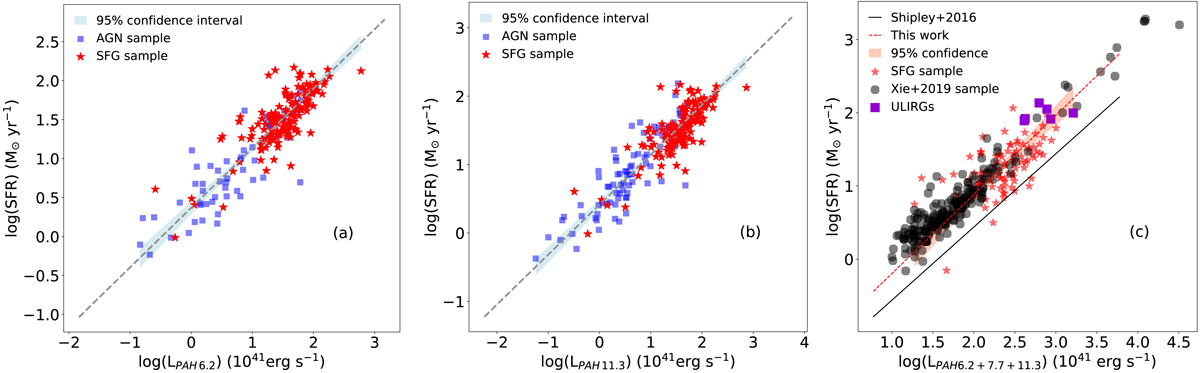
Fig. 6.
Download original image
a: correlation between the PAH emission feature at 6.2 μm, expressed in units of 1041 erg s−1 and the SFR derived from the total IR luminosity (black line) for a composite catalogue of SFGs (red star) and AGN-dominated galaxies (blue square). The shaded area in the three plots indicates the 95% confidence interval. b: correlation between the PAH emission feature at 11.3 μm, expressed in units of 1041 erg s−1 and the SFR derived from the total IR luminosity (black line) for a composite catalogue of SFGs (red star) and AGN-dominated galaxies (blue square). Panels a and b: we exclude ULIRGs from both AGN and SFG samples due to the known PAH deficit in these sources, as well as AGN with luminosities above 1045 erg s−1, which could dominate the IR continuum used to estimate the SFR. c: comparison of the relation between PAH total luminosity and SFR derived by Shipley et al. (2016) (black solid line) and using our sample (red dashed line). Red stars indicate SFG, purple squares indicate the ULIRG sub-sample included in the GOALS sample, and grey circles represent a sample of local galaxies used in Xie & Ho (2019).
Current usage metrics show cumulative count of Article Views (full-text article views including HTML views, PDF and ePub downloads, according to the available data) and Abstracts Views on Vision4Press platform.
Data correspond to usage on the plateform after 2015. The current usage metrics is available 48-96 hours after online publication and is updated daily on week days.
Initial download of the metrics may take a while.