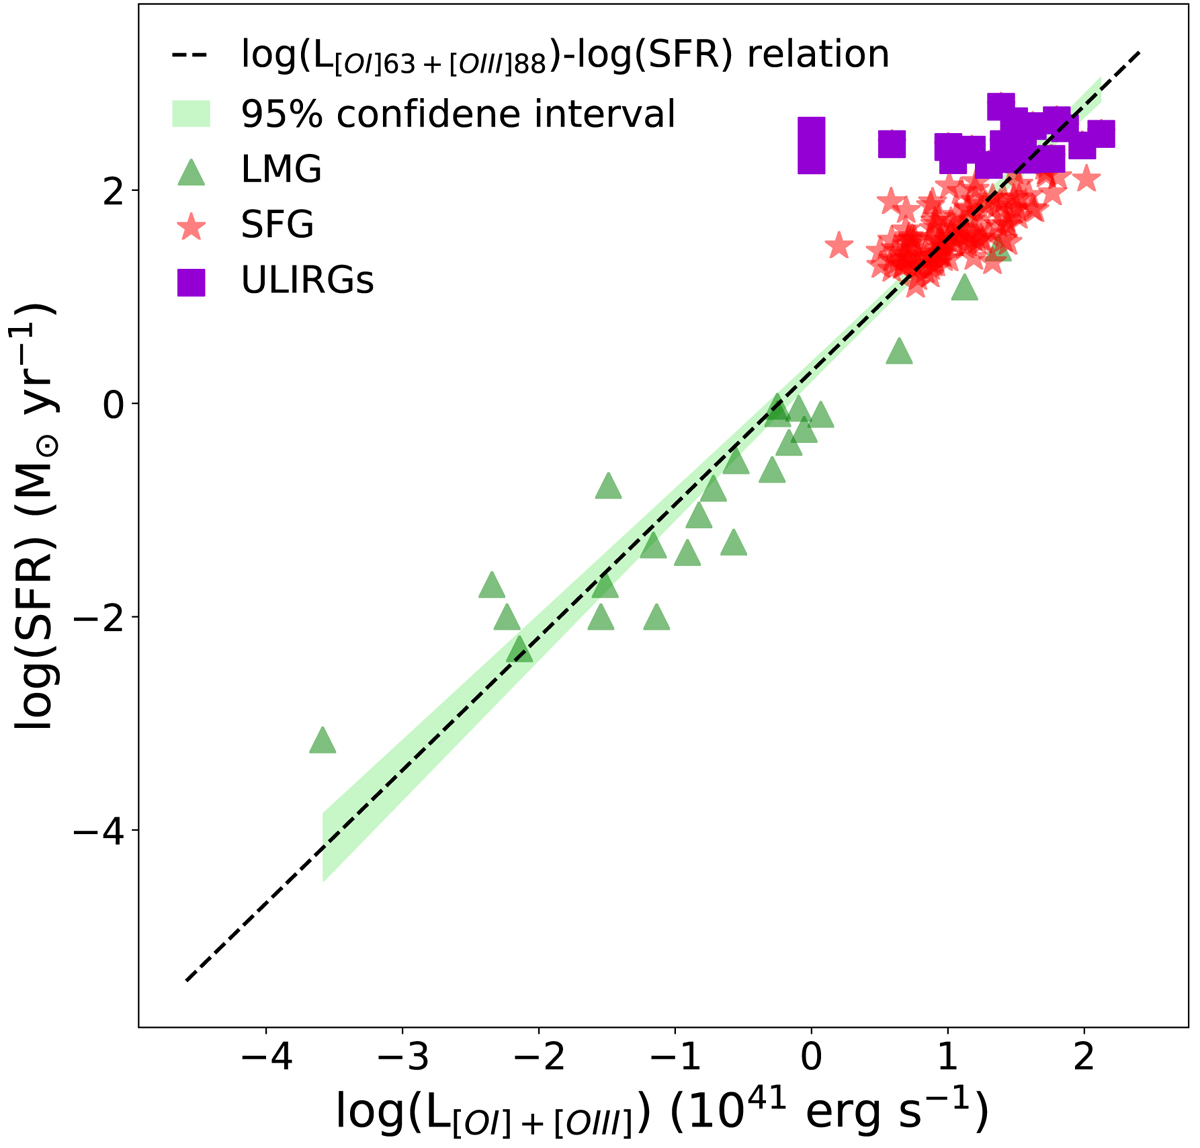
Fig. 4.
Download original image
Correlation between the [OI]63 μm and [OIII]88 μm summed emission line luminosities, in units of 1041 erg s−1, and the SFR derived from the total IR luminosity (black dashed line) for a composite sample of SFGs (red stars) and from the Hα luminosity (corrected for the IR luminosity) for LMG (green triangles). Purple squares indicate the sample of ULIRGs included in the SFG sample.
Current usage metrics show cumulative count of Article Views (full-text article views including HTML views, PDF and ePub downloads, according to the available data) and Abstracts Views on Vision4Press platform.
Data correspond to usage on the plateform after 2015. The current usage metrics is available 48-96 hours after online publication and is updated daily on week days.
Initial download of the metrics may take a while.