Fig. 3.
Download original image
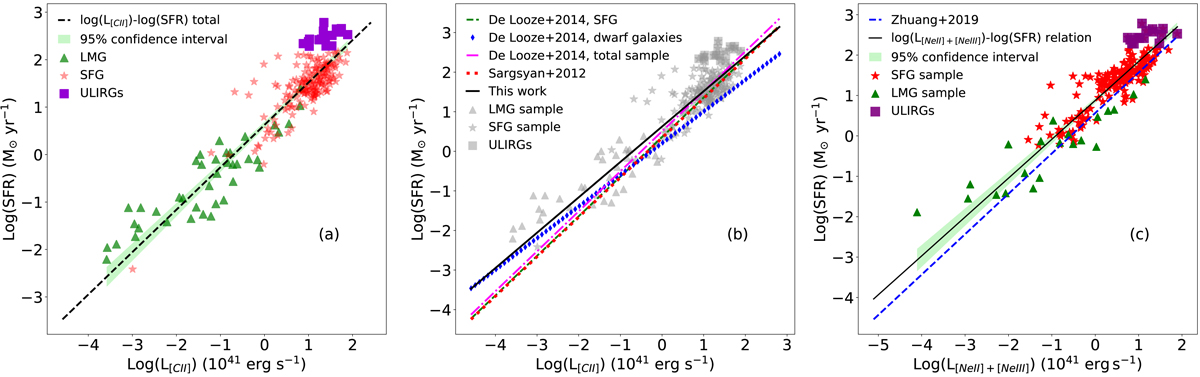
a: correlation between the [CII]158 μm line luminosity and the SFR derived from the total LIR. Red stars represent SFG, and green triangles represent the LMG. Purple squares show the ULIRG population of SFG, and the shaded green area indicates the 95% confidence interval. b: comparison of the log L[CII]–log(SFR) relation obtained in this work (black solid line) with the results obtained by De Looze et al. (2014); the green dashed line represents a sample of HII or SFGs, the blue diamond line shows the results for the low-metallicity dwarf sample, and the pink dash-dotted line considers the whole sample. The red dotted line shows the results obtained by Sargsyan et al. (2012). c: correlation between the [NeII]12.8 μm and [NeIII]15.6 μm summed emission lines’ luminosity, in units of 1041 erg s−1, and the SFR derived from the total IR luminosity (black dashed line) for SFGs (red star) and from the Hα luminosity (corrected for the IR luminosity) for LMGs (green triangles). The shaded green area indicates the 95% confidence interval. The purple squares highlight the ULIRG population in the SFG sample. The blue dashed line shows the results obtained by Zhuang et al. (2019) for the same relation.
Current usage metrics show cumulative count of Article Views (full-text article views including HTML views, PDF and ePub downloads, according to the available data) and Abstracts Views on Vision4Press platform.
Data correspond to usage on the plateform after 2015. The current usage metrics is available 48-96 hours after online publication and is updated daily on week days.
Initial download of the metrics may take a while.