Fig. E.4.
Download original image
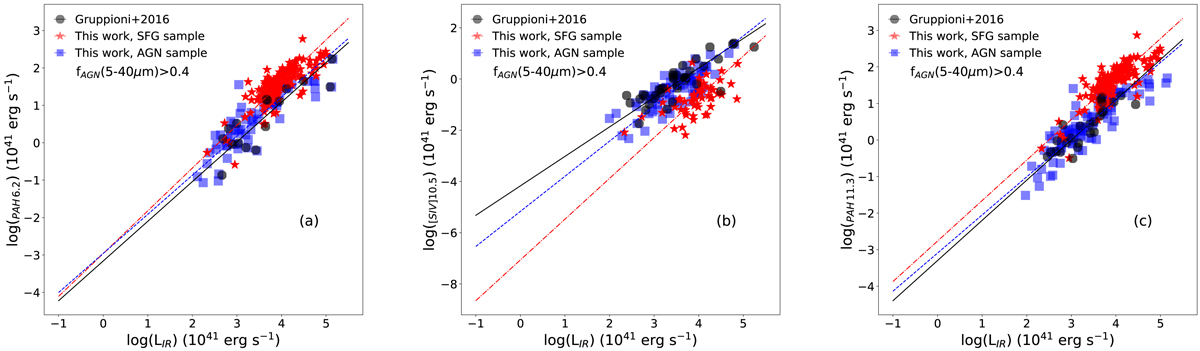
a: left: PAH 6.2 μm luminosity versus the total IR luminosity. Blue squares represent AGN, red stars SFGs, and black circles show the sample of Gruppioni et al. (2016). The dashed blue line represents the linear relation for AGN, the dot-dashed red line the relation for SFG, and the black solid line the relation for the Gruppioni et al. (2016) sample. b: centre: [SIV]10.5 μm luminosity versus the total IR luminosity. c: right: PAH 11.3 μm luminosity versus the total IR luminosity. In all three figures, the Gruppioni et al. (2016) sample was limited to AGN fractions > 0.4 in the 5−40 μm spectral interval (see Sect. 4.3).
Current usage metrics show cumulative count of Article Views (full-text article views including HTML views, PDF and ePub downloads, according to the available data) and Abstracts Views on Vision4Press platform.
Data correspond to usage on the plateform after 2015. The current usage metrics is available 48-96 hours after online publication and is updated daily on week days.
Initial download of the metrics may take a while.