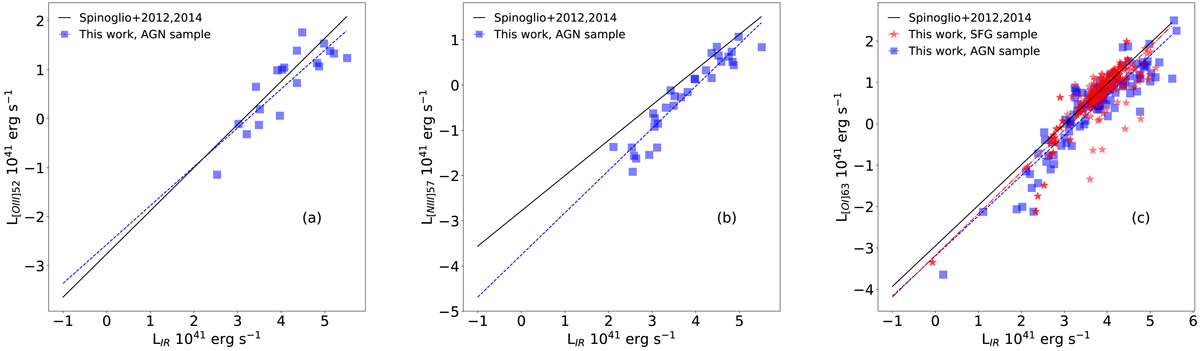
Fig. E.1.
Download original image
a: left: [OIII]52 μm line luminosity versus the total IR luminosity. b: centre: [NIII]57 μm line luminosity versus the total IR luminosity. c: right: [OI]63 μm line luminosity versus the total IR luminosity. In the figures, blue squares represent AGN while red stars show the SFG sample. The dashed blue line represents the linear correlation for the AGN sample, the dot-dashed red line shows the relation for SFG, and the black solid line the relation shows the relation obtained by Spinoglio et al. (2012, 2014).
Current usage metrics show cumulative count of Article Views (full-text article views including HTML views, PDF and ePub downloads, according to the available data) and Abstracts Views on Vision4Press platform.
Data correspond to usage on the plateform after 2015. The current usage metrics is available 48-96 hours after online publication and is updated daily on week days.
Initial download of the metrics may take a while.