Fig. C.1.
Download original image
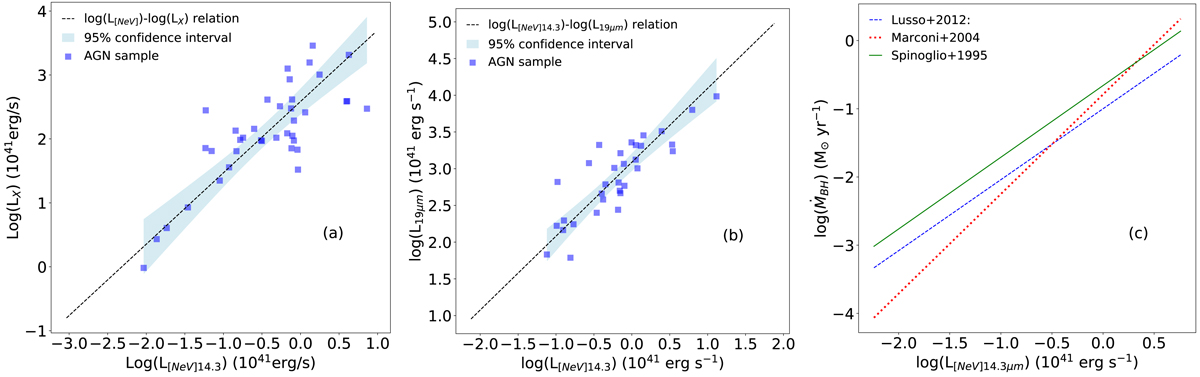
a: left: linear correlation between the [NeV]14.3 μm and the 2−10 keV X-ray luminosity. Blue squares show the AGN sample, and the shaded area shows the 95% confidence interval for the relation. b: centre: linear correlation between the [NeV]14.3 μm line luminosity and the 19 μm luminosity. c: right: comparison between the [NeV]14.3 μm line luminosity and the BHAR derived from the bolometric corrections by Spinoglio et al. (1995, green solid line), Marconi et al. (2004, red dotted line), and Lusso et al. (2012, blue dashed line).
Current usage metrics show cumulative count of Article Views (full-text article views including HTML views, PDF and ePub downloads, according to the available data) and Abstracts Views on Vision4Press platform.
Data correspond to usage on the plateform after 2015. The current usage metrics is available 48-96 hours after online publication and is updated daily on week days.
Initial download of the metrics may take a while.