Fig. B.9.
Download original image
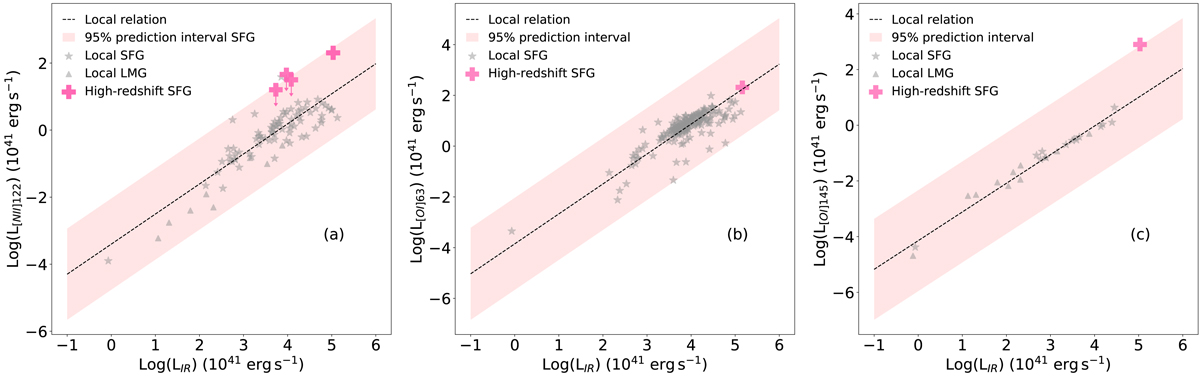
a: left: comparison between the local LIR–L[NII]122 relation for local SFGs (black dashed line) and high-redshift detections of [NII]122 μm line. The shaded area shows the 95% prediction interval for the local relation. The pink + sign indicates a detection for the [NII]122 μm line (De Breuck et al. 2019), while symbols with arrows indicate upper limits for high-redshift sources (Harikane et al. 2020). b: centre: comparison between the local LIR–L[OI]63 relation for local SFGs (black dashed line) and high-redshift detections of the [OI]63 μm line (pink symbol Rybak et al. 2020). c: right: comparison between the local LIR–L[OI]145 relation for local SFGs (black dashed line) and high-redshift detections of [OI]145 μm line (pink symbol De Breuck et al. 2019). The shaded area shows the 95% prediction interval for the local relation. Grey stars show local SFGs, while grey triangles show local LMGs.
Current usage metrics show cumulative count of Article Views (full-text article views including HTML views, PDF and ePub downloads, according to the available data) and Abstracts Views on Vision4Press platform.
Data correspond to usage on the plateform after 2015. The current usage metrics is available 48-96 hours after online publication and is updated daily on week days.
Initial download of the metrics may take a while.