Fig. 8.
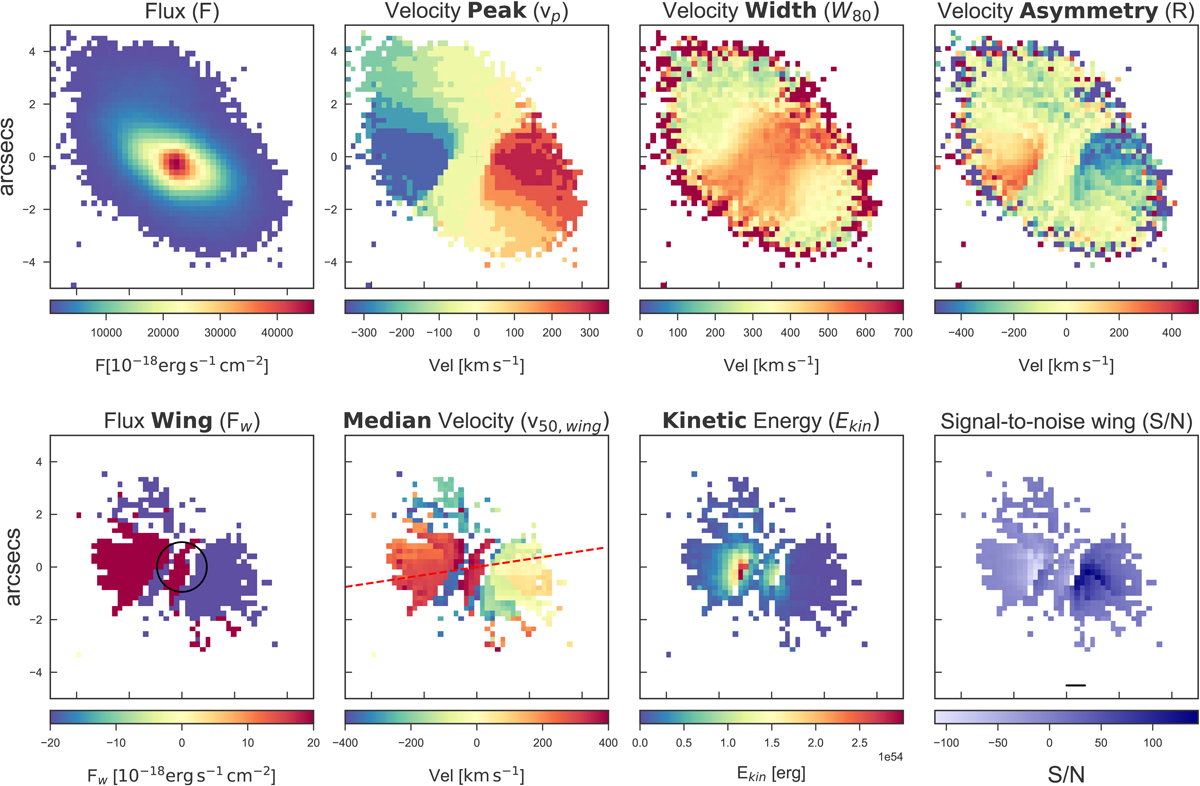
Download original image
Spatially resolved maps of the parameters defined in Sect. 4 for 3C 033. The maps are centered on the nucleus of the source, identified by the [O III] peak luminosity. Top panelfrom left to right: (1) [O III] flux, (2) velocity peak (vp) of the [O III] emission line, (3) emission line width (W80), and (4) velocity asymmetry of the [O III] profile. Bottom panelfrom left to right: (1) flux of the outflowing gas isolated by the rotational component (Fw), the black circle has a diameter of three times the seeing of the observations; (2) median velocity of the outflowing gas (v50, wing), the dashed line marks the radio position angle; (3) kinetic energy of the [O III] emitting gas; and (4) S/N of the [O III] emission residing in the line wing. In all maps, pixels with an S/N < 5 have been discarded.
Current usage metrics show cumulative count of Article Views (full-text article views including HTML views, PDF and ePub downloads, according to the available data) and Abstracts Views on Vision4Press platform.
Data correspond to usage on the plateform after 2015. The current usage metrics is available 48-96 hours after online publication and is updated daily on week days.
Initial download of the metrics may take a while.