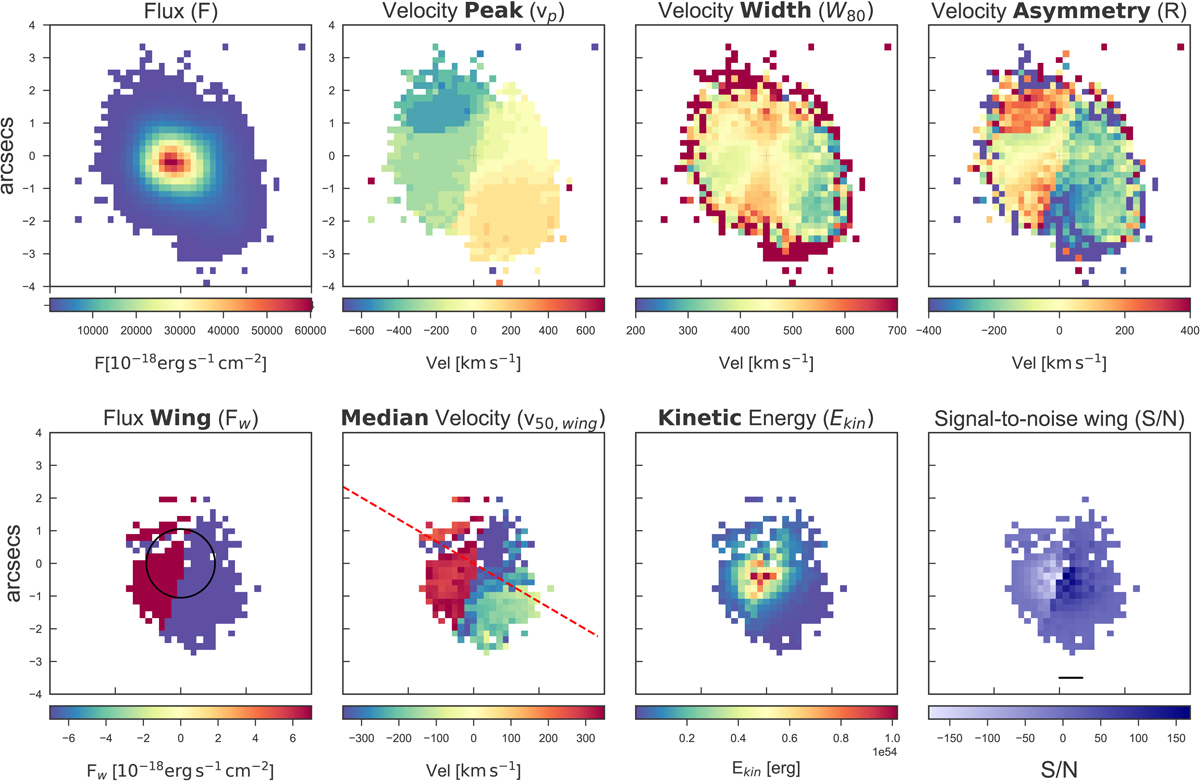
Fig. A.21.
Download original image
3C 327, HEG, 1″ = 1.87 kpc. The black circle in the first panel has a diameter of 3 times the seeing of the observations; the dashed line in the second panel marks the radio position angle. Both component of the outflow are detected with a S/N above 100. To the west the ionized gas reaches positive velocities and in the opposite side negatives, achieving a maximum values by ∼1440 km s−1. The maps are well resolved, the energy peaks at the center then decreases more and more towards the external region (up to ∼3.74 kpc).
Current usage metrics show cumulative count of Article Views (full-text article views including HTML views, PDF and ePub downloads, according to the available data) and Abstracts Views on Vision4Press platform.
Data correspond to usage on the plateform after 2015. The current usage metrics is available 48-96 hours after online publication and is updated daily on week days.
Initial download of the metrics may take a while.