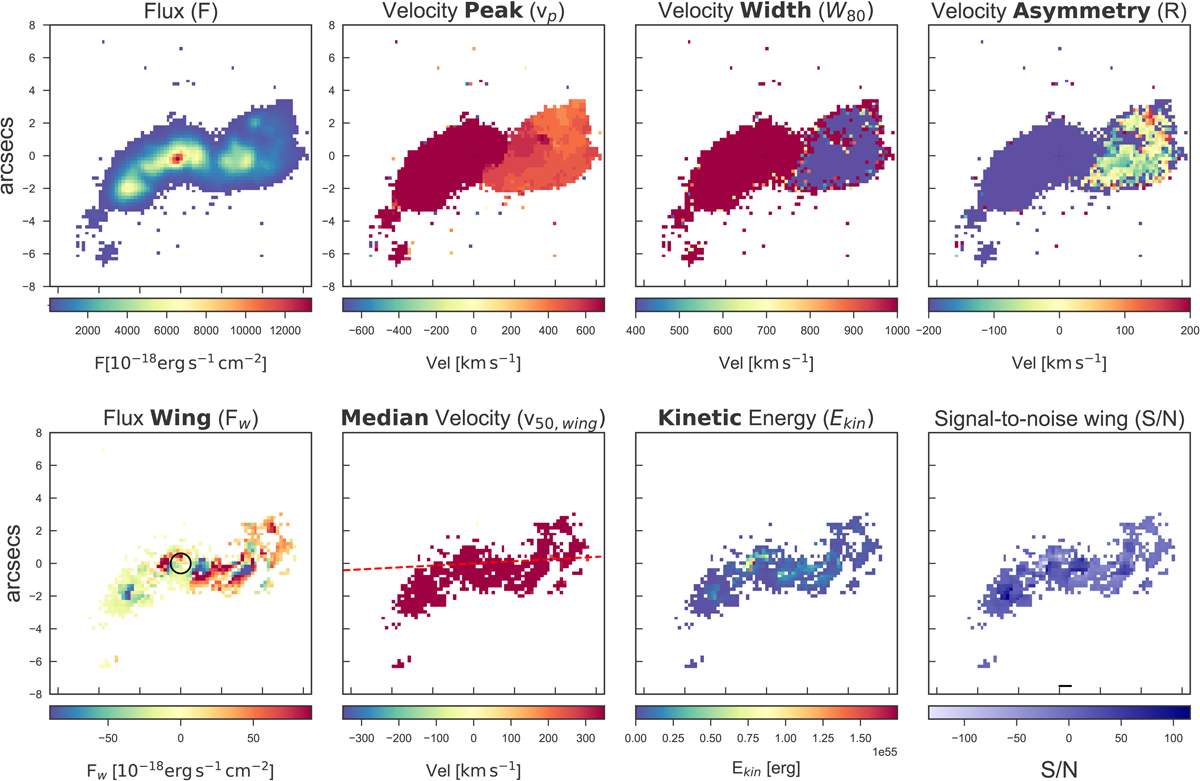
Fig. A.20.
Download original image
3C 300, HEG, 1″ = 3.88 kpc. The black circle in the first panel has a diameter of 3 times the seeing of the observations; the dashed line in the second panel marks the radio position angle. This source shows an elliptical shape (the most extended f our sample) with a residual filamentary structure in the NE direction. The whole major axis of the ellipse has a length of ∼7.2″ (∼27.94 kpc), from its east end the emission lines extend beyond ∼12″ (∼9.31 kpc). The flux of the gas is major in correspondence with the nucleus and it peaks again at ∼14.25 kpc toward SW from the center. The outflow is mainly dominated by the blue component which maximum velocity is ∼ − 2160 km s−1. The red component of the gas is detected in the NE filaments with a velocity that arrives up to ∼1450 km s−1. The kinetic energy presents two peaks located in the same position as those of the flux. This double peak is probably a sign of two sources from which the outflow originates.
Current usage metrics show cumulative count of Article Views (full-text article views including HTML views, PDF and ePub downloads, according to the available data) and Abstracts Views on Vision4Press platform.
Data correspond to usage on the plateform after 2015. The current usage metrics is available 48-96 hours after online publication and is updated daily on week days.
Initial download of the metrics may take a while.