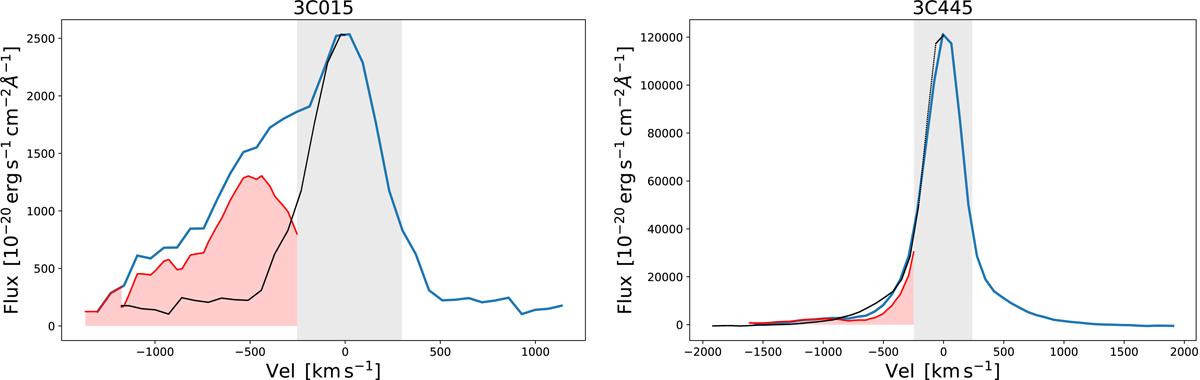
Fig. 3.
Download original image
Nuclear spectra of 3C 015 and 3C 445. Left panel: observed [O III] emission line is shown (in blue) with the mirror image of the redshifted line (in black). Their difference (in red) reveals a blueshifted wing in the profile, with ionized gas that reaches high negative velocities. We masked the central region of the [O III] profile – at one-third of the maximum height of the emission line (grey region) – not considering the gas in ordered rotation. We measured the median velocity (v50) of the outflow measured on the blue-wing residual component.
Current usage metrics show cumulative count of Article Views (full-text article views including HTML views, PDF and ePub downloads, according to the available data) and Abstracts Views on Vision4Press platform.
Data correspond to usage on the plateform after 2015. The current usage metrics is available 48-96 hours after online publication and is updated daily on week days.
Initial download of the metrics may take a while.