Fig. A.6.
Download original image
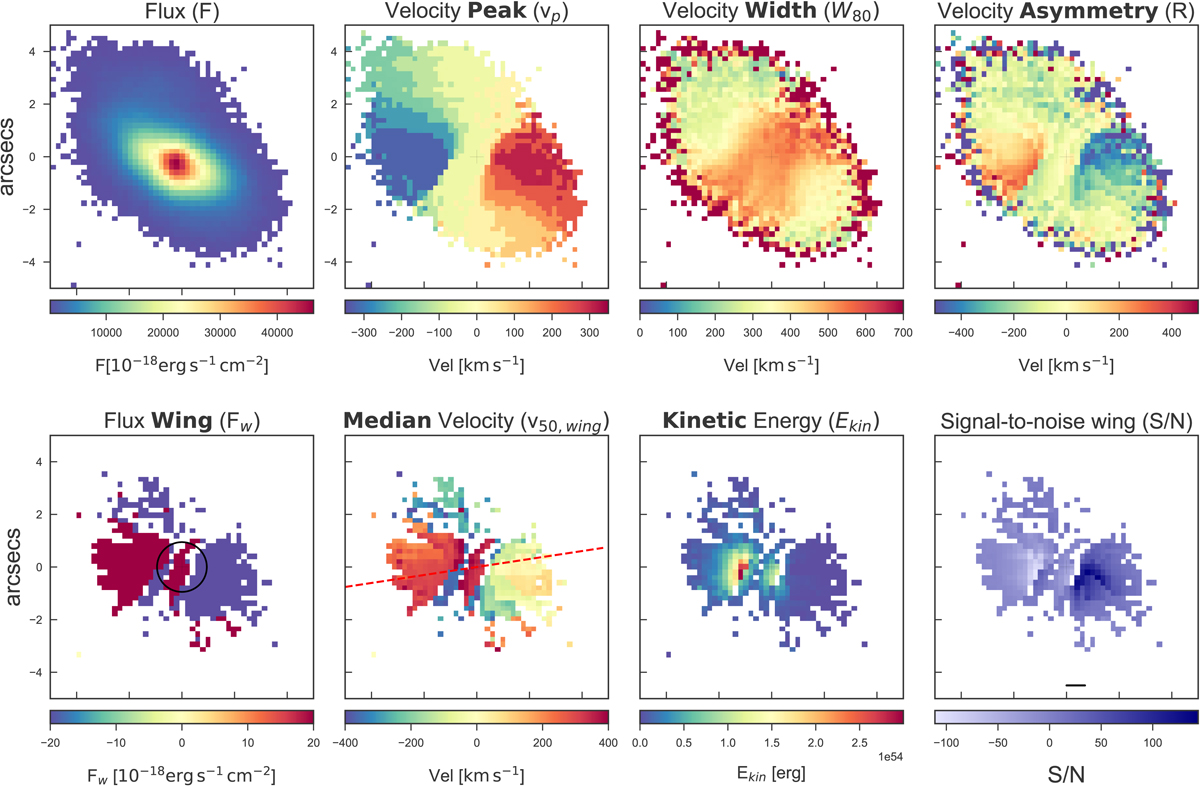
3C 033, HEG, 1″ = 1.14 kpc. The black circle in the first panel has a diameter of 3 times the seeing of the observations; the dashed line in the second panel marks the radio position angle. We observe an outflow symmetrically extended towards the NW and the SE directions out to ∼3.4″ (∼3.88 kpc) from the nucleus. In the NW region the gas assumes positive velocities (up to ∼1800 km s−1) and in the SE negative values (up to ∼2000 km s−1), in both cases they slowly decrease along the maximum extension. The kinetic energy grows from the most external regions close to the center, reaching the maximum values at ∼1.00 kpc from the nucleus and decreasing again approaching the center. This is due to our field of view in which the nucleus is obscured by the torus surrounding the central engine. In fact the highest values of S/N are measured in the same area in which the energy gets the greatest values.
Current usage metrics show cumulative count of Article Views (full-text article views including HTML views, PDF and ePub downloads, according to the available data) and Abstracts Views on Vision4Press platform.
Data correspond to usage on the plateform after 2015. The current usage metrics is available 48-96 hours after online publication and is updated daily on week days.
Initial download of the metrics may take a while.