Fig. 2.
Download original image
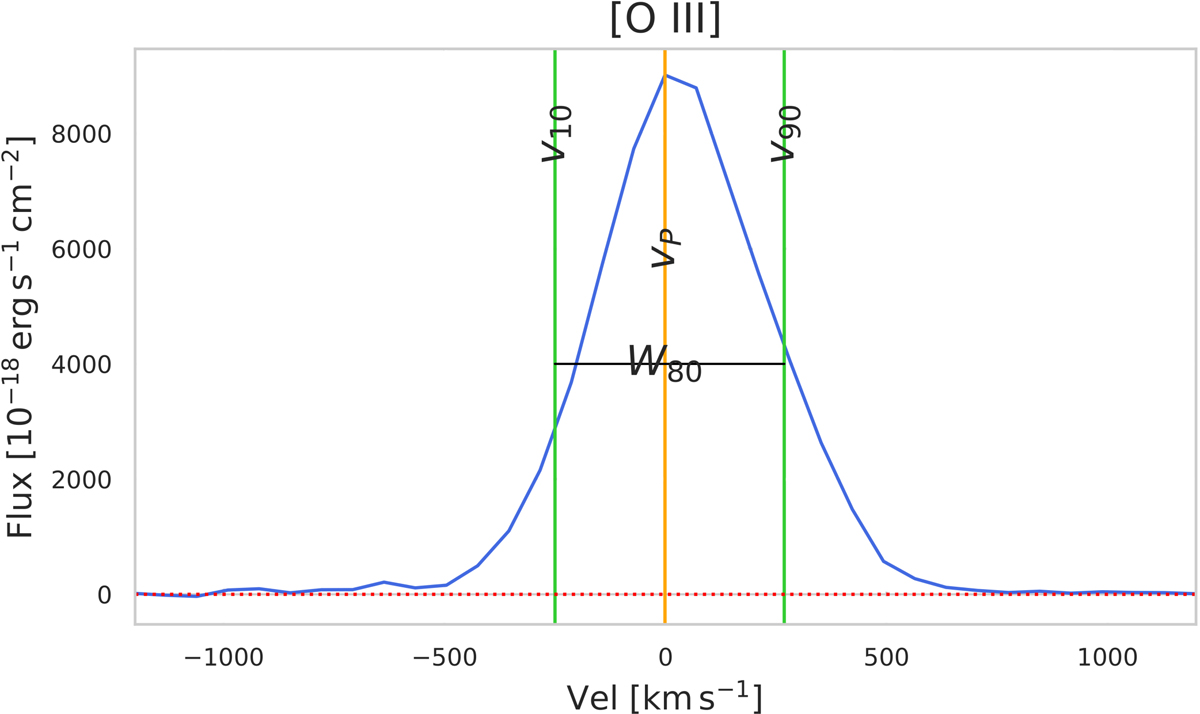
Example of the [O III] emission-line profile (blue curve) of 3C 033 in the brightest spaxel of the image. The vertical orange line represents the velocity of the peak flux density (vp), and the green vertical lines show the 10th (v10) and 90th (v90) velocity percentiles, which are used for the definition of the velocity width of the line that contains 80% of the emission line flux (W80). In this spectrum the redshifted wing dominates, producing a positive value of the asymmetry (R > 0). The dotted red horizontal line is the continuum, linearly interpolated and subtracted.
Current usage metrics show cumulative count of Article Views (full-text article views including HTML views, PDF and ePub downloads, according to the available data) and Abstracts Views on Vision4Press platform.
Data correspond to usage on the plateform after 2015. The current usage metrics is available 48-96 hours after online publication and is updated daily on week days.
Initial download of the metrics may take a while.