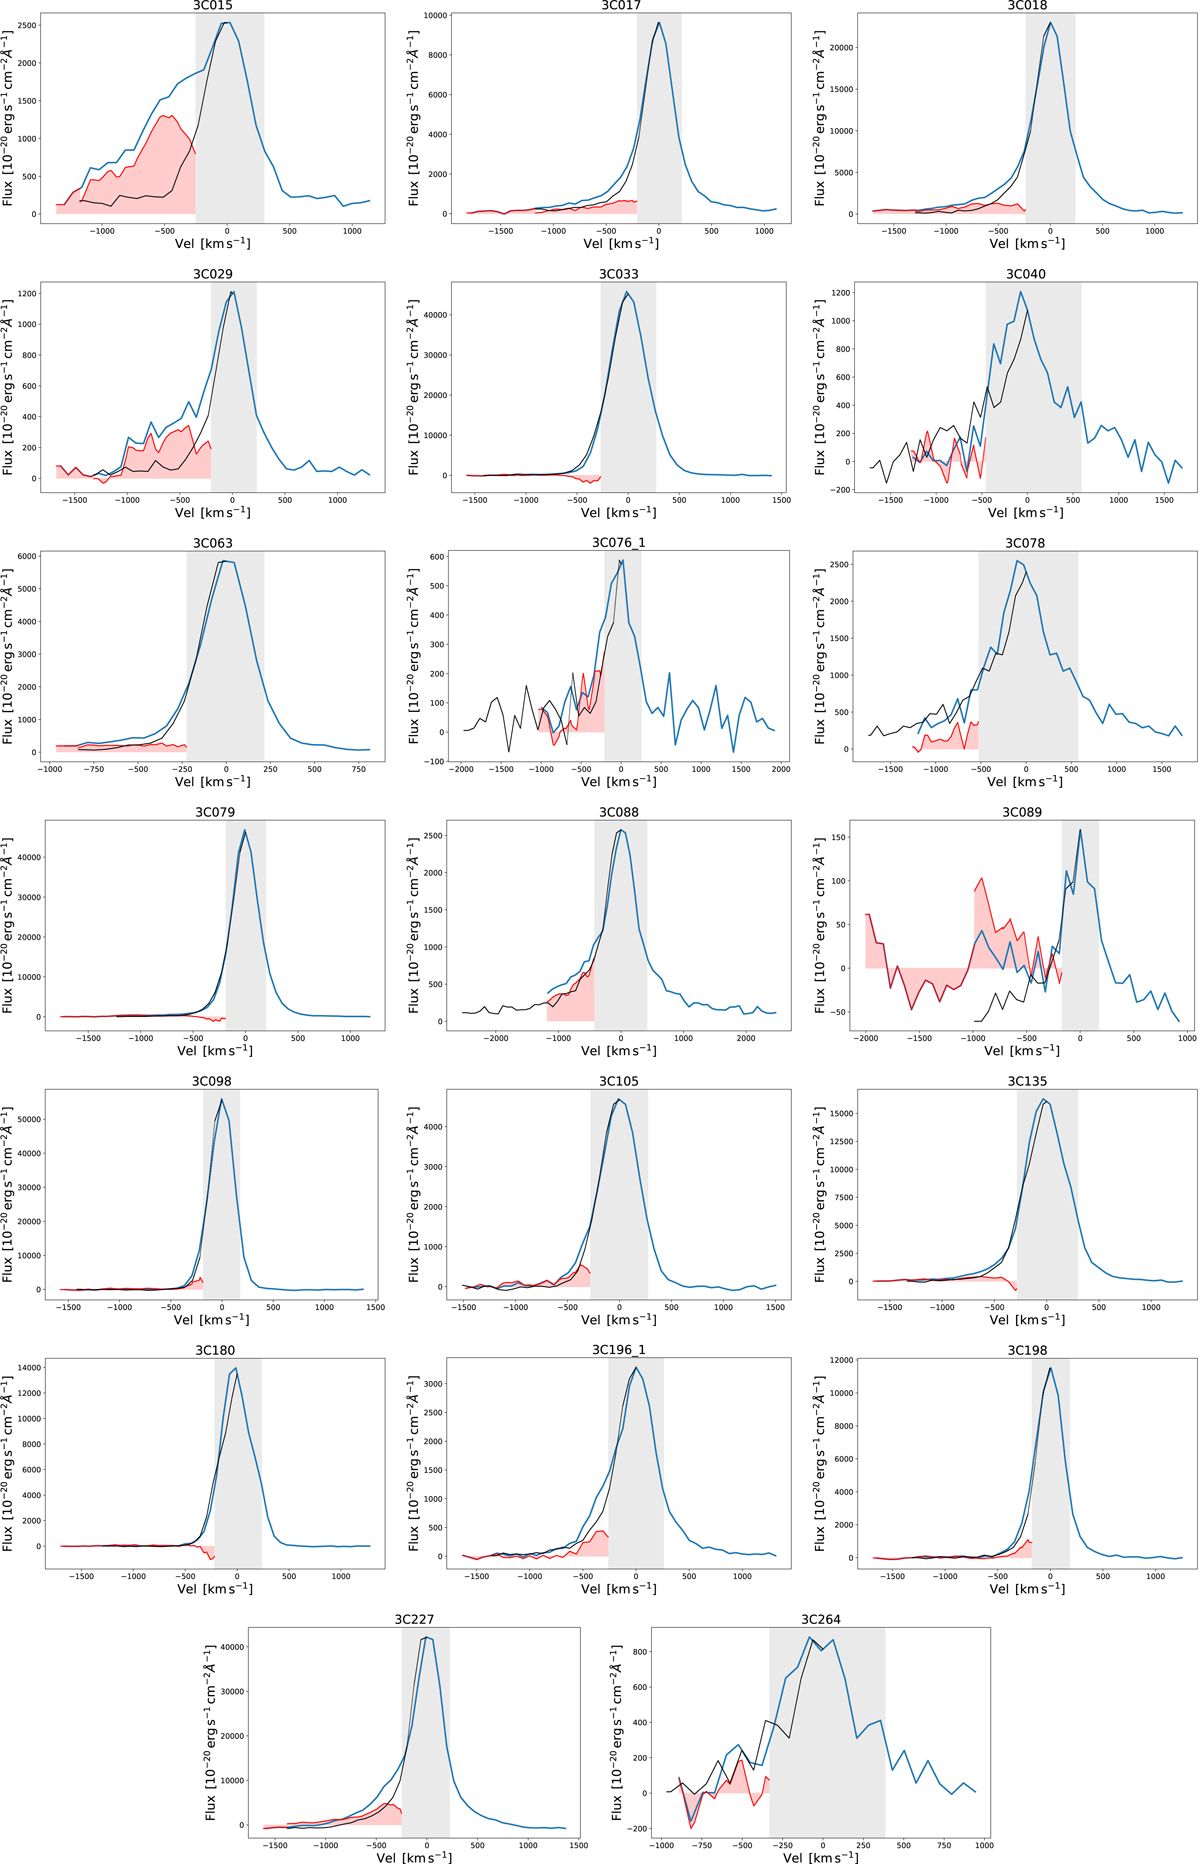
Fig. A.1.
Download original image
Nuclear spectra of the 33 3C sources with a detection of the [O III] emission line. Superposed on the [O III] profile (blue) is the mirror image of the redshifted line (black). Their difference (red) reveals any line asymmetry. We estimated the median velocity (V50) of the asymmetric line wing and its flux (Fw), after masking the spectral region at one-third of the maximum height of the profile (grey region).
Current usage metrics show cumulative count of Article Views (full-text article views including HTML views, PDF and ePub downloads, according to the available data) and Abstracts Views on Vision4Press platform.
Data correspond to usage on the plateform after 2015. The current usage metrics is available 48-96 hours after online publication and is updated daily on week days.
Initial download of the metrics may take a while.