Fig. 6
Download original image
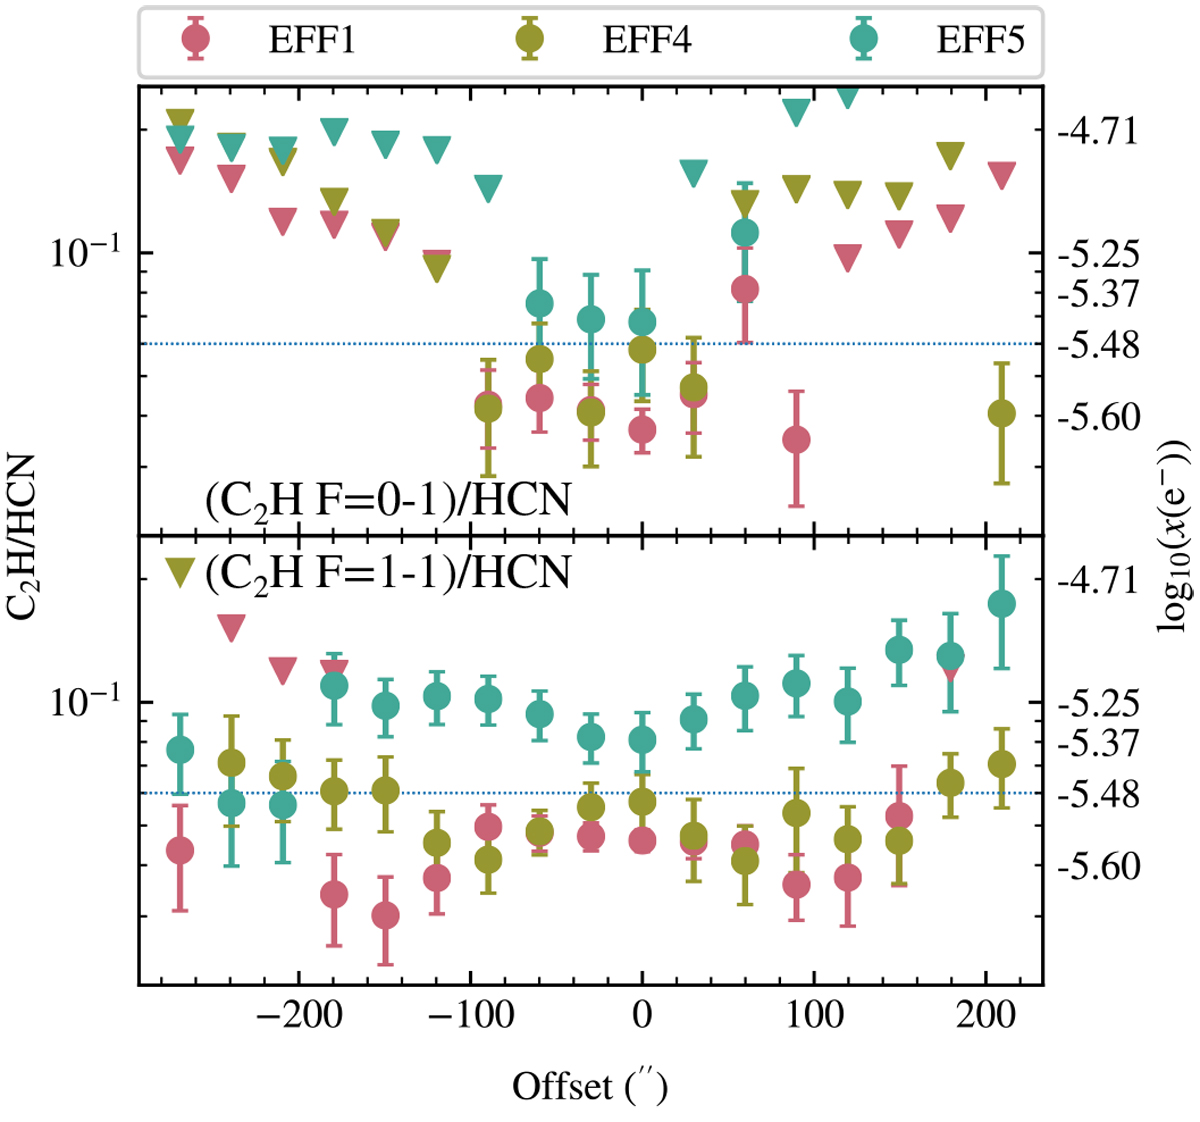
Ratio between C2H(1–0) J = 1∕2–1∕2 and HCN(1–0) for EFF1, EFF4 and EFF5. We use this ratio to put an upper limit to x(e−) in the gas traced by HCN using the models of Bron et al. (2021) (right axis). Top: ratio between C2 H(1–0) J = 1∕2–1∕2 F = 0–1 and HCN(1–0) for EFF1, EFF4 and EFF5. Bottom: ratio between C2H(1–0) J = 1∕2–1∕2 F = 1–1 and HCN(1–0) for EFF1, EFF4 and EFF5. The intensity of the F = 1–1 line is scaled to that of the F = 0–1 line by assuming a 2:1 ratio. The ratios are computed by averaging over a slice of 2′ in the Dec direction centered in the regions. The offsets are shown along the RA direction and are referenced to the center of the region (Table 2). Inverted triangles show 3σ upper limits.
Current usage metrics show cumulative count of Article Views (full-text article views including HTML views, PDF and ePub downloads, according to the available data) and Abstracts Views on Vision4Press platform.
Data correspond to usage on the plateform after 2015. The current usage metrics is available 48-96 hours after online publication and is updated daily on week days.
Initial download of the metrics may take a while.