Free Access
Fig. 5
Download original image
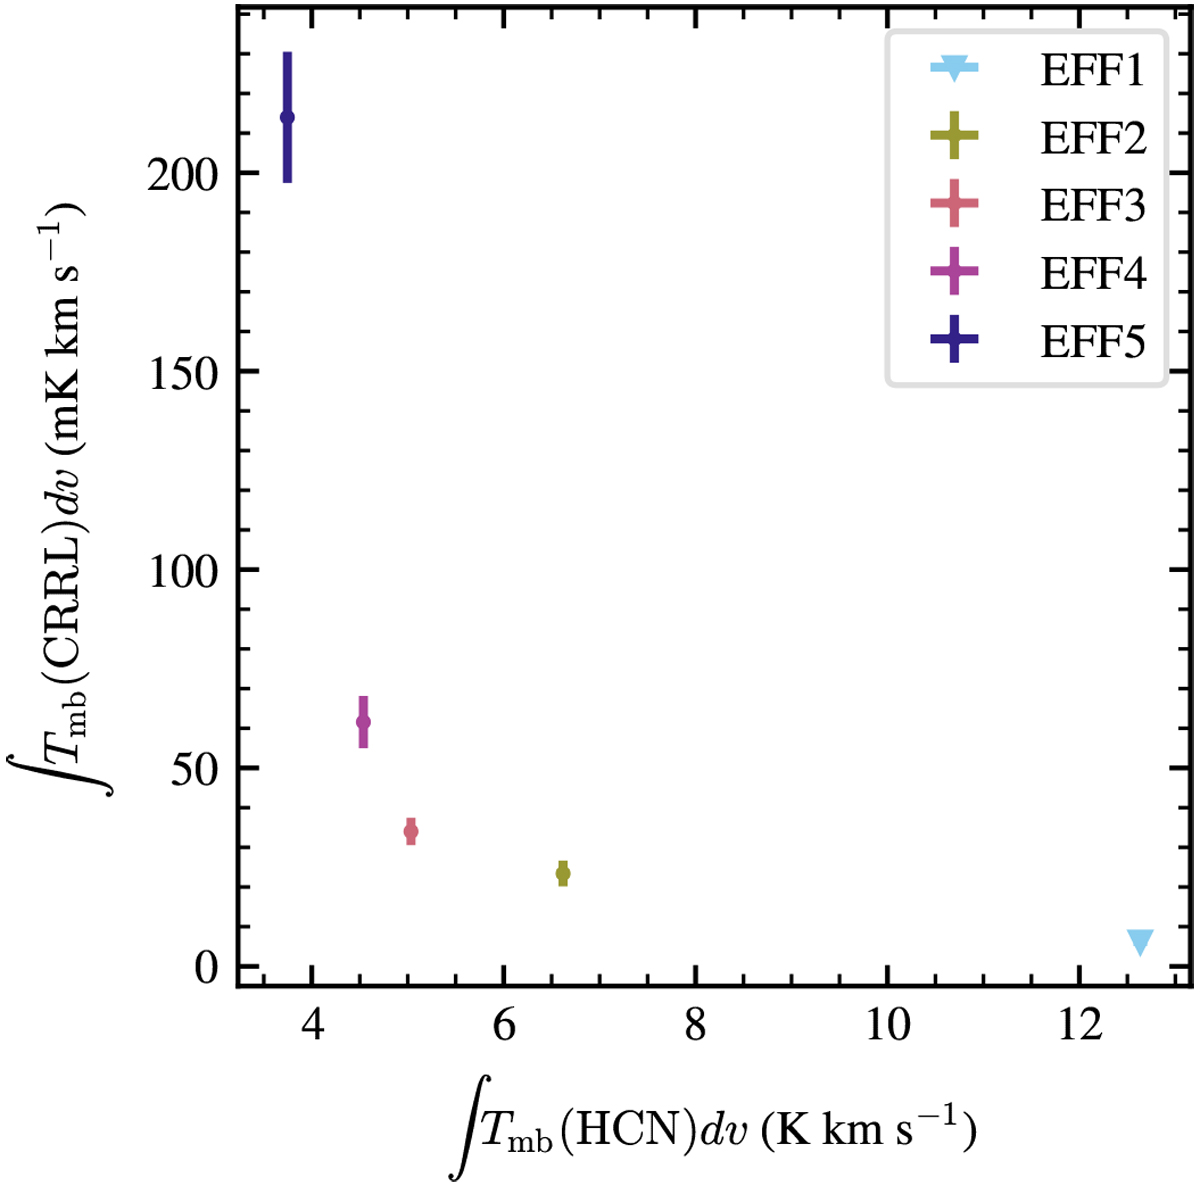
Intensity of the averaged CRRLs as a function of the intensity of the HCN(1–0) line. The intensities of both lines are anticorrelated. The error bars are 1σ, and the inverted triangle shows the 3σ upper limit for the CRRL intensity toward EFF1.
Current usage metrics show cumulative count of Article Views (full-text article views including HTML views, PDF and ePub downloads, according to the available data) and Abstracts Views on Vision4Press platform.
Data correspond to usage on the plateform after 2015. The current usage metrics is available 48-96 hours after online publication and is updated daily on week days.
Initial download of the metrics may take a while.